
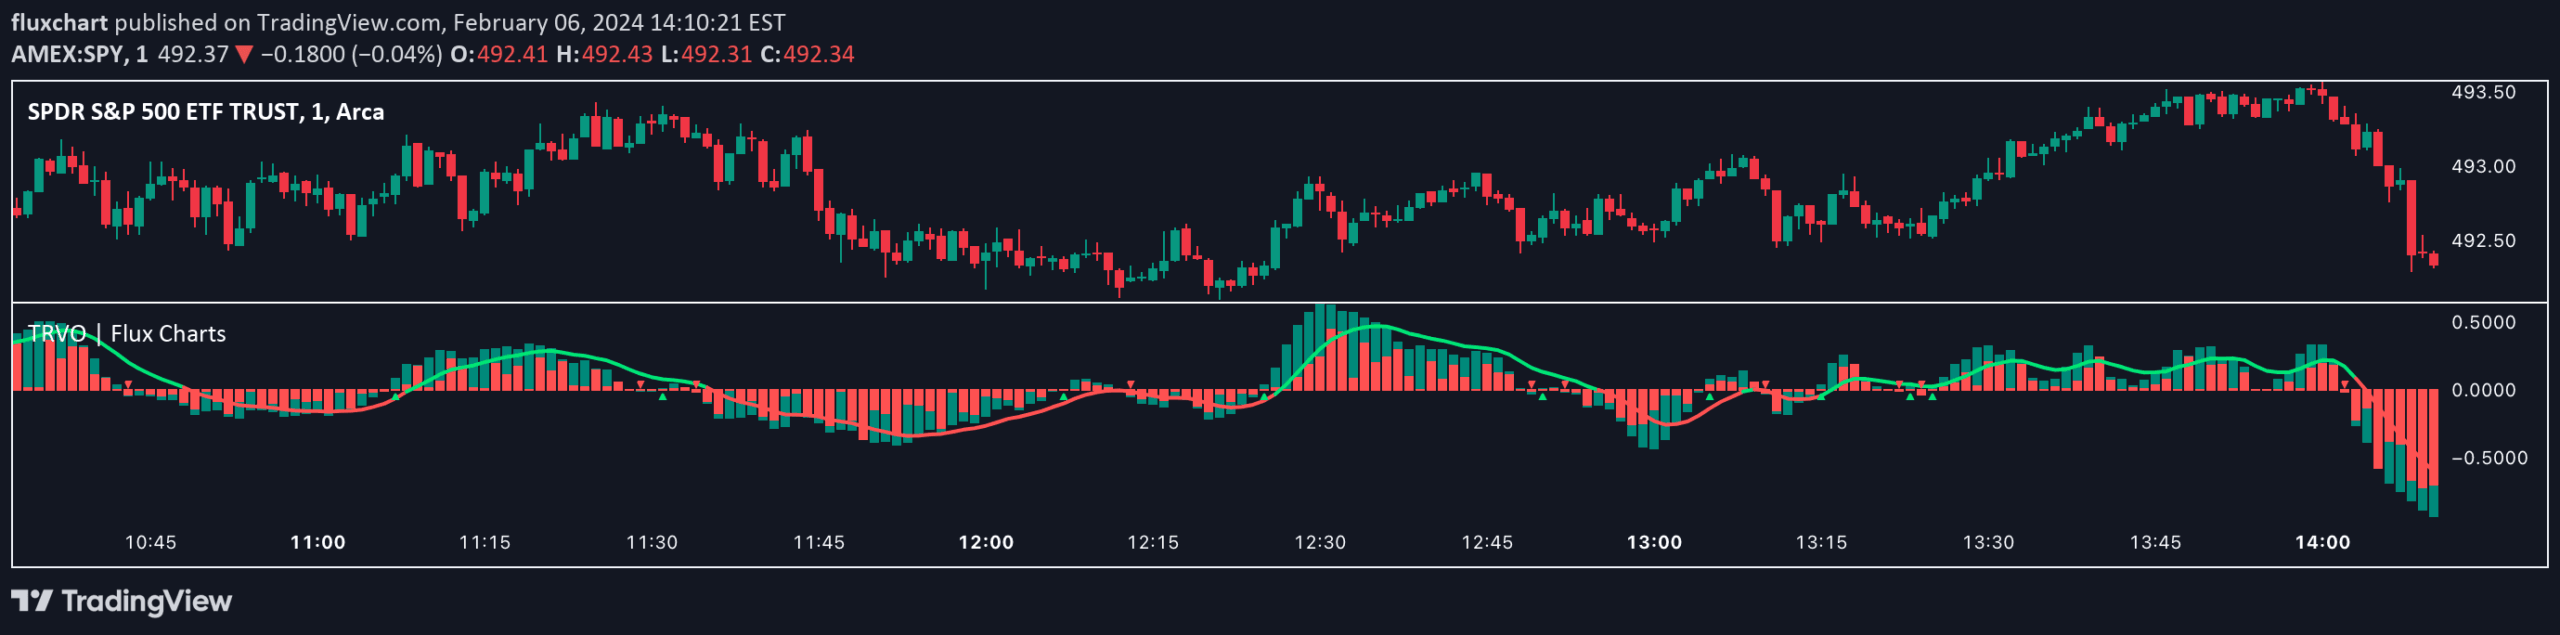
A sophisticated volume indicator that compares trading volumes across different sessions, offering multiple modes to analyze volume dynamics and trading momentum.
Explore complementary indicator rolesHow it works
The relative volume indicator calculates volume comparison by examining trading sessions instead of individual candles, providing a more comprehensive view of market activity. It operates through three primary modes: classic, oscillator, and delta volume, each offering unique insights into trading volume dynamics.
The classic mode displays actual volume with a relative volume overlay, while the oscillator mode uses two EMAs to show volume direction. The delta volume mode separates buy and sell volumes, displaying them distinctly and providing an oscillator that tracks volume changes between bullish and bearish market conditions.
Why it may be useful
Volume analysis is crucial for understanding market sentiment and potential price movements, as it reveals the strength behind price actions and trader participation. This indicator goes beyond traditional volume measurements by offering multiple perspectives and sophisticated calculations that smooth out noise and provide more accurate insights.
By comparing volumes across trading sessions and using advanced calculation methods like sigmoid function variations, traders can gain deeper insights into market dynamics. The indicator helps identify potential trend reversals, volume momentum shifts, and provides a more nuanced understanding of buying and selling pressures.
When to explore it
The relative volume indicator works best on lower time frames where more comparative data is available, making it particularly useful for short-term trading strategies. It is most effective in oscillating markets where volume fluctuations can provide meaningful signals about potential trend changes and market sentiment.
Traders should pay special attention to the delta volume mode when looking for significant direction changes, as the oscillator can highlight moments when buying or selling volume becomes dominant. The indicator is particularly valuable during periods of market uncertainty or when seeking confirmation of potential trend reversals.
Keep exploring
What we’ve verified
Access, alerts and repainting behaviour have not been independently verified for this indicator. Check the creator’s current publication and settings.
General descriptions and classifications are recovered research. Verified details above identify the specific checks we have completed. Check the creator’s current publication for later changes.




