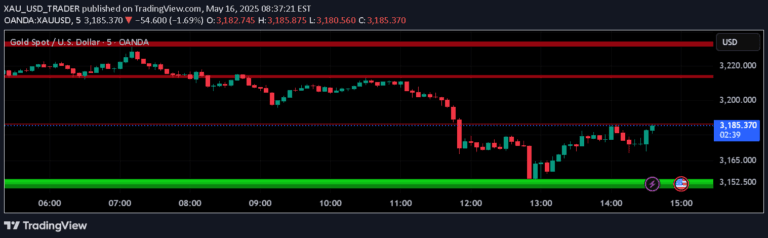
A comprehensive trading toolbar that provides compact, color-coded insights into market conditions using multiple technical indicators and metrics across different timeframes.
Explore complementary indicator rolesHow it works
Toolbar-Fren operates by calculating multiple technical indicators simultaneously, primarily on the daily timeframe to provide a comprehensive market overview. It computes key metrics like percentage changes, moving average distances, and technical indicators such as RSI and ADX, presenting them in a vertically organized, color-coded display.
The indicator dynamically calculates percentages and distances from critical technical levels, using color gradients to instantly communicate market conditions. By integrating various calculations like Average Daily Range, moving average distances, and trend strength indicators, it transforms complex numerical data into an intuitive, easily digestible visual format.
Why it may be useful
Toolbar-Fren simplifies complex market analysis by consolidating multiple technical indicators into a single, compact display, enabling traders to quickly assess market conditions without overwhelming chart space. Its color-coded system provides immediate visual feedback about price movement, trend strength, and potential market dynamics, allowing traders to make faster, more informed decisions.
By presenting a holistic view of market metrics, the indicator helps traders understand broader market context and identify potential trading opportunities more efficiently. The customizable nature of the toolbar ensures that traders can adapt the display to their specific trading style and preferences, making technical analysis more accessible and actionable.
When to explore it
Toolbar-Fren is most effective during periods of moderate to high market volatility, where quick interpretation of multiple technical signals can provide a competitive edge. It is particularly useful for traders who require a comprehensive overview of market conditions across different timeframes and technical perspectives.
The indicator is especially valuable during intraday trading, when rapid decision-making is crucial, and for traders who prefer a data-rich yet visually streamlined approach to market analysis. Its flexibility in customization makes it adaptable to various trading styles, from scalping to swing trading, and across different financial instruments.
Keep exploring
What we’ve verified
Access, alerts and repainting behaviour have not been independently verified for this indicator. Check the creator’s current publication and settings.
General descriptions and classifications are recovered research. Verified details above identify the specific checks we have completed. Check the creator’s current publication for later changes.