
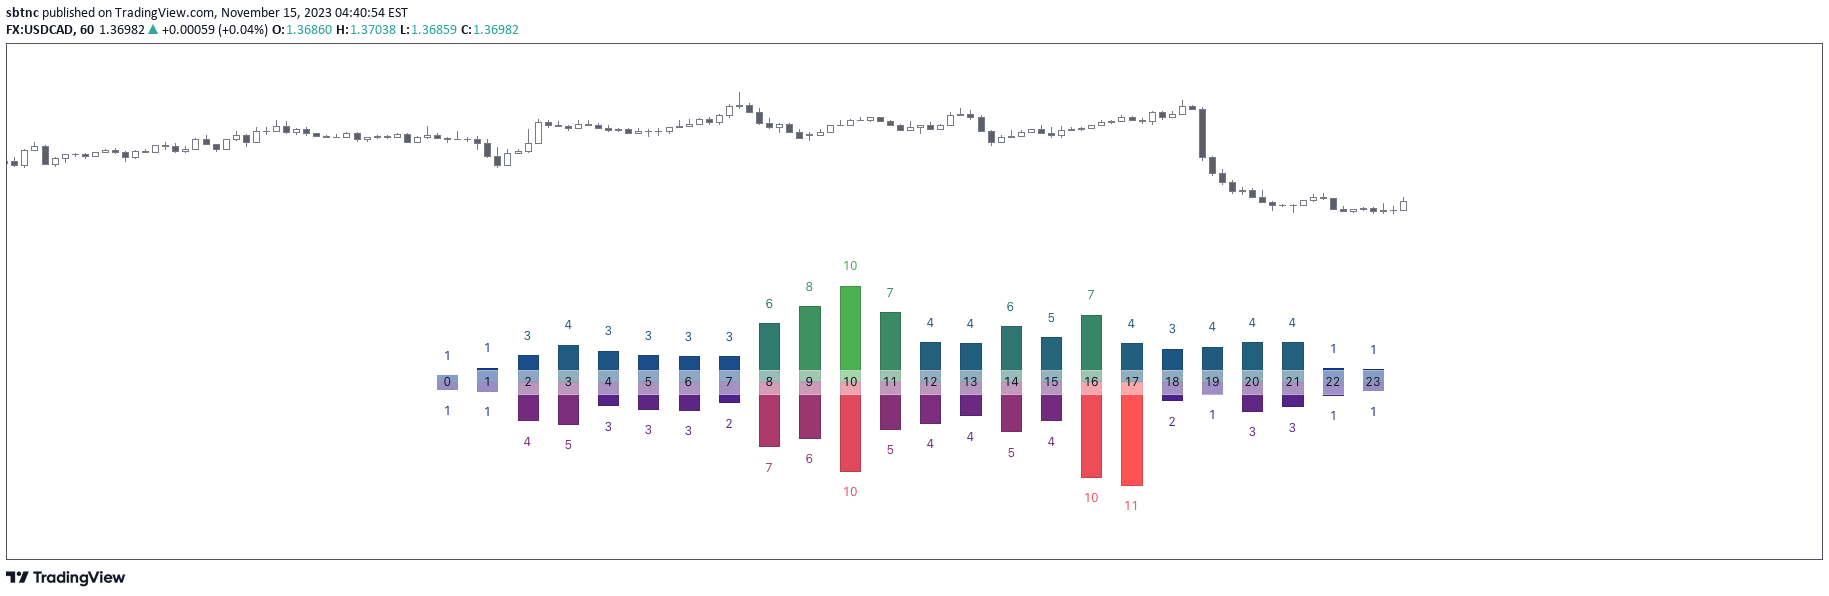
A trading indicator that tracks and reports the percentage of daily market tops and bottoms by time of day, helping traders understand market reversal patterns and optimal entry/exit points.
Explore complementary indicator rolesHow it works
The indicator analyzes historical price data to calculate the percentage of times specific market events occur at different times during the trading day. It collects data on daily highs and lows, tracking when they typically happen within the trading session.
By examining a significant number of trading days, the indicator generates a statistical representation of market behavior. It breaks down the day into time segments and shows the probability of market reversals or significant price movements. The analysis helps traders understand recurring patterns in their specific trading instruments
Why it may be useful
Understanding market timing patterns can significantly improve trading decisions and risk management. This indicator provides insights into when markets are most likely to experience reversals or significant price movements. Traders can use this information to optimize their entry and exit strategies, reducing the likelihood of entering trades at unfavorable times.
The statistical approach offers a data-driven perspective on market behavior, helping traders make more informed decisions. By revealing historical trends, the indicator can help traders anticipate potential market shifts and adjust their strategies accordingly
When to explore it
This indicator is most effective when used on liquid, frequently traded markets with consistent daily patterns. It works best on timeframes of 1-hour or 30-minutes, providing a robust sample size of trading days. Traders should use it in conjunction with other technical and fundamental analysis tools.
It is particularly useful for day traders and swing traders looking to understand market timing nuances. The indicator is most valuable when applied to markets with predictable intraday movements, such as major forex pairs or actively traded stock indices
Keep exploring
What we’ve verified
Access, alerts and repainting behaviour have not been independently verified for this indicator. Check the creator’s current publication and settings.
General descriptions and classifications are recovered research. Verified details above identify the specific checks we have completed. Check the creator’s current publication for later changes.


