SuperBollingerTrend (Expo)
SuperBollingerTrend combines Bollinger Bands and SuperTrend to analyze market volatility and trend direction, providing traders insights into potential trend changes and breakouts.
Explore 11,183 indicators. Filter beyond the obvious.
Discover the tools that fit the way you trade.
11,183 tools to explore
SuperBollingerTrend combines Bollinger Bands and SuperTrend to analyze market volatility and trend direction, providing traders insights into potential trend changes and breakouts.
Live Economic Calendar tracks global financial news events, providing real-time updates on market-moving events across multiple currencies with impact levels and detailed visualizations.
A TradingView script that displays quarterly earnings per share and sales data with year-on-year percentage changes, offering customizable visualization of financial performance metrics.
A trading signal identifying significant price movement at market open caused by extraordinary news, using the opening gap as a potential trading target.
A dynamic trend analysis tool that measures market momentum by tracking wave sizes, speed, and trend direction using advanced moving average techniques.
A trading tool that tracks major economic events and their potential market impact, helping traders understand pivotal moments in financial markets.
A comprehensive financial indicator that displays up to 9 fundamental metrics from income statements, balance sheets, cash flow, and financial statistics directly on your trading chart.
The Diluted Earnings Per Share Signal (DEPSS) is a fundamental indicator that analyzes earnings surprises by comparing diluted EPS to analyst estimates to generate trading signals.
World Clocks is a fun visualization tool that displays time across different global locations, providing real-time updates and synchronization with chart data.
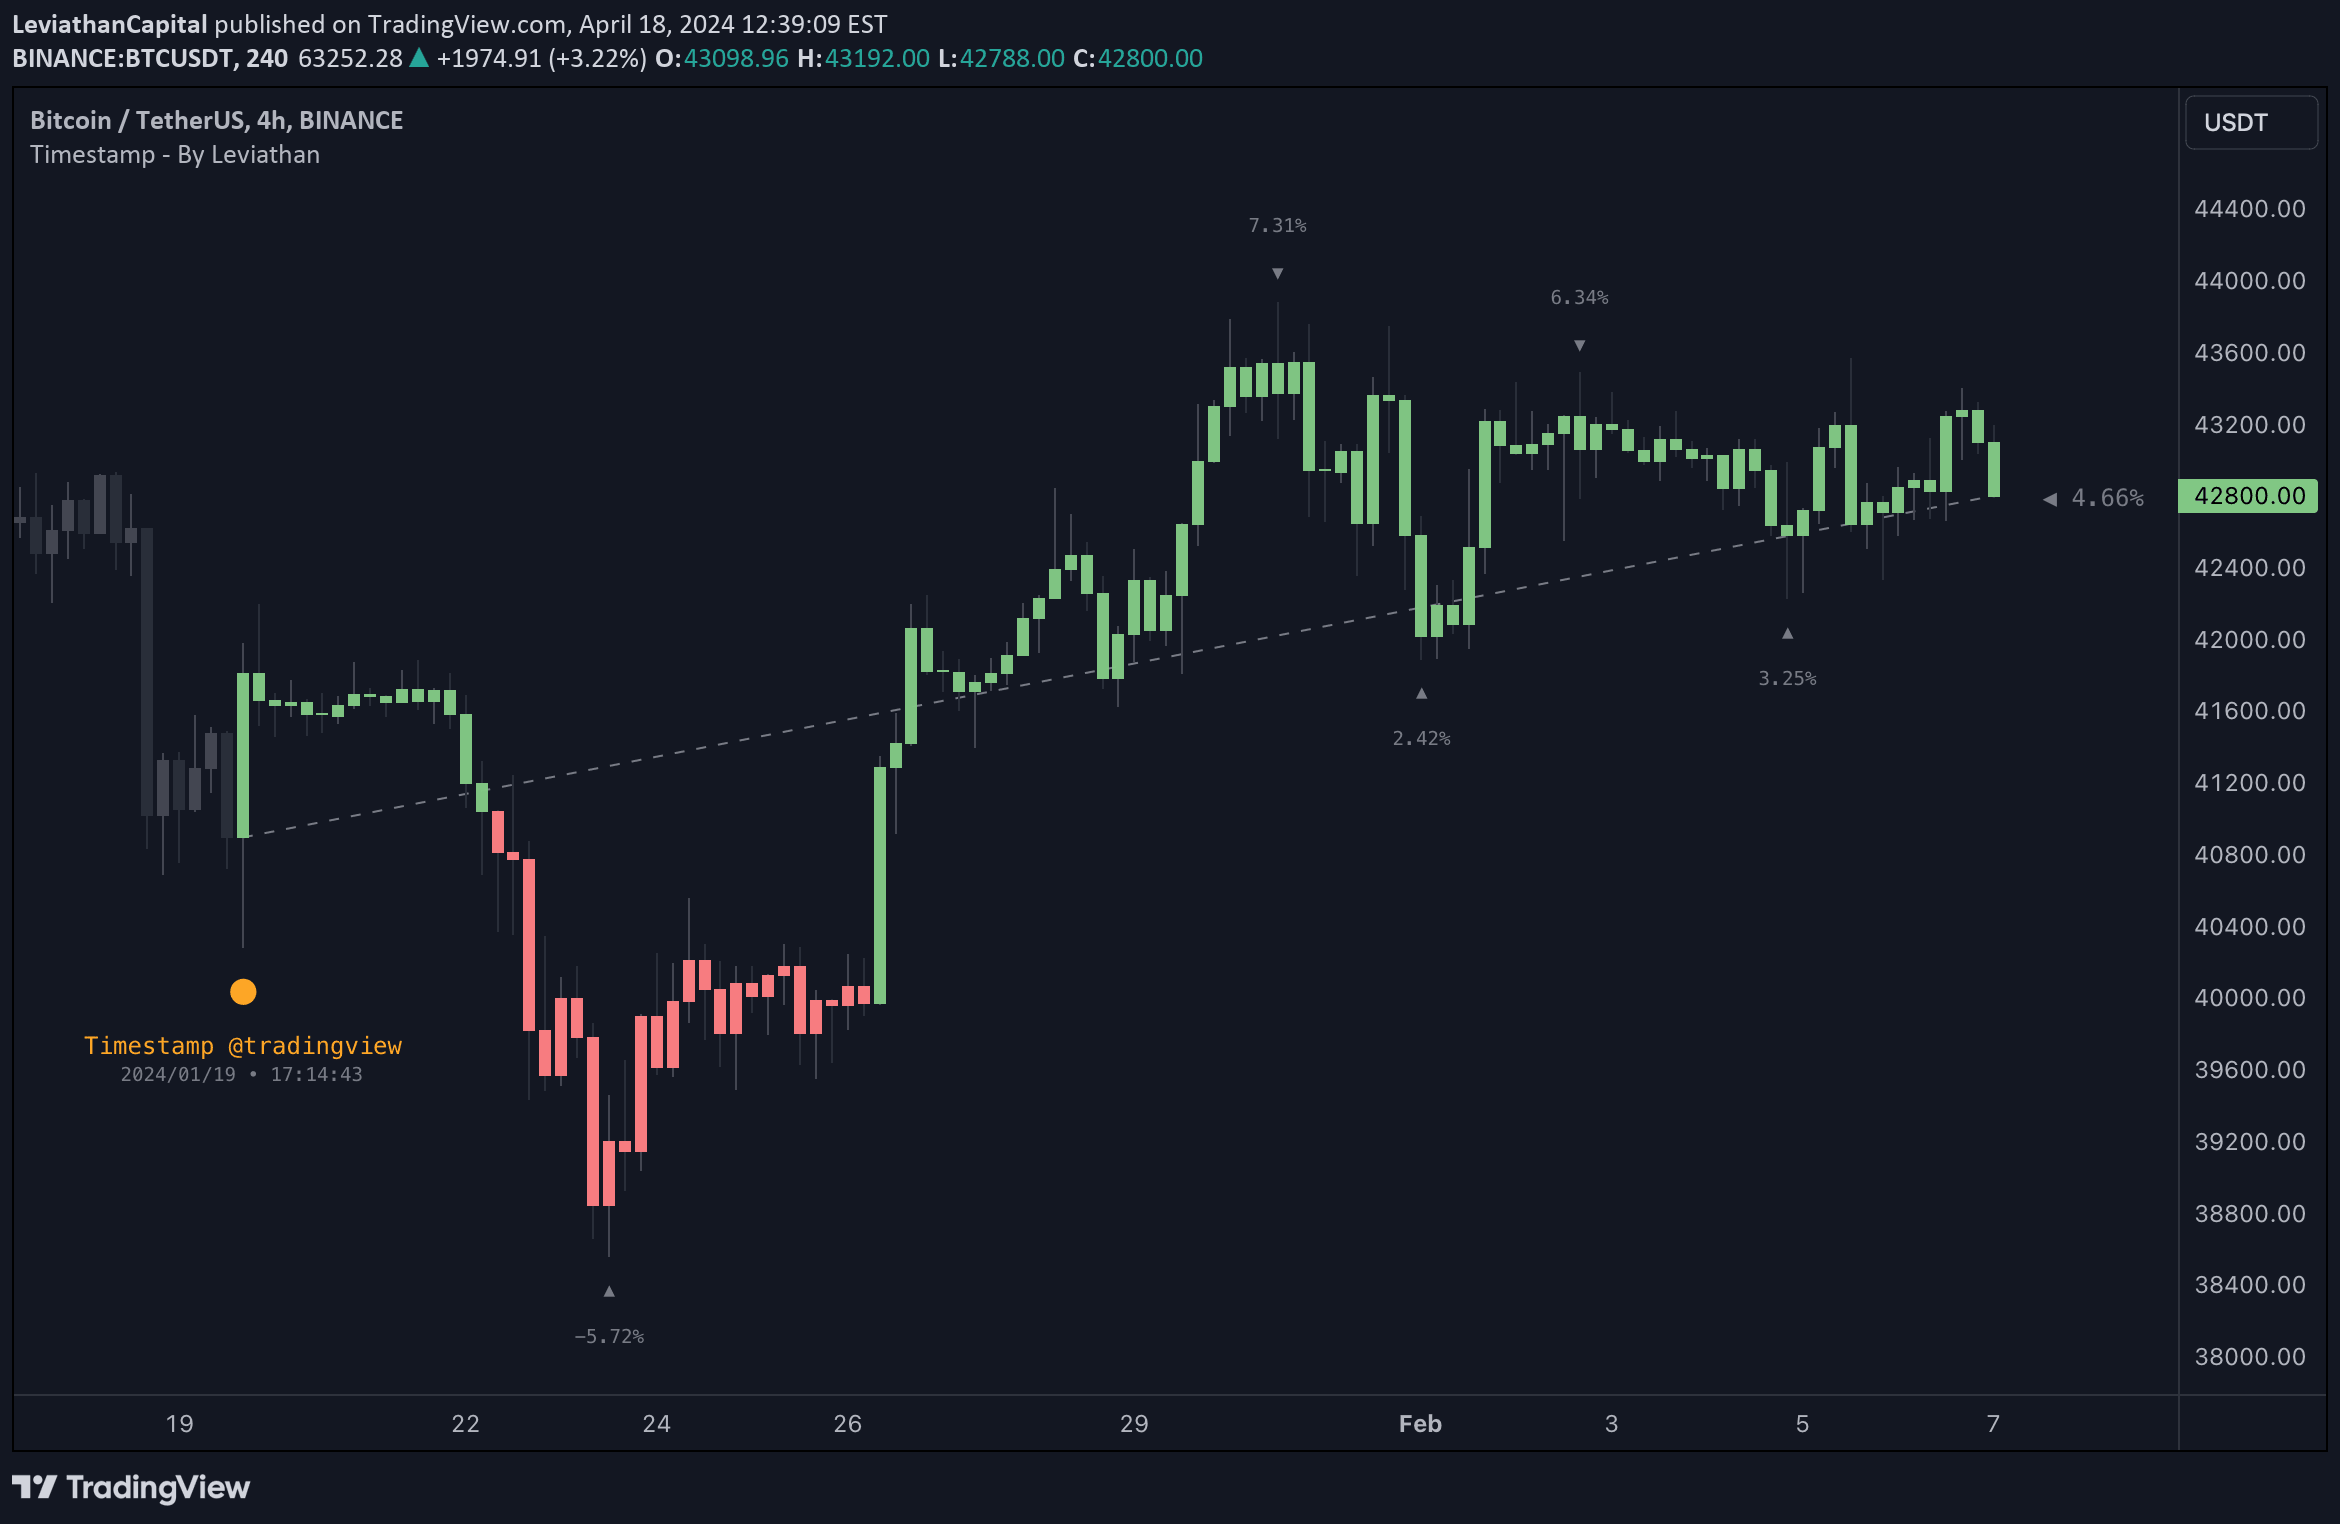
A tool for traders to generate visual timestamps of X/Twitter posts directly on trading charts, aligning social media content with market price actions and events.
A financial analysis tool that compares quarterly, annual, and TTM performance metrics, providing comprehensive insights into company growth through various financial indicators and visualization options.
An experimental scalping overlay combining Andean Oscillator signals with a relative-bandwidth filter. It displays long and short markers and includes alerts.
Likes, views, and comments are historical TradingView snapshots. They describe attention, not trading performance.