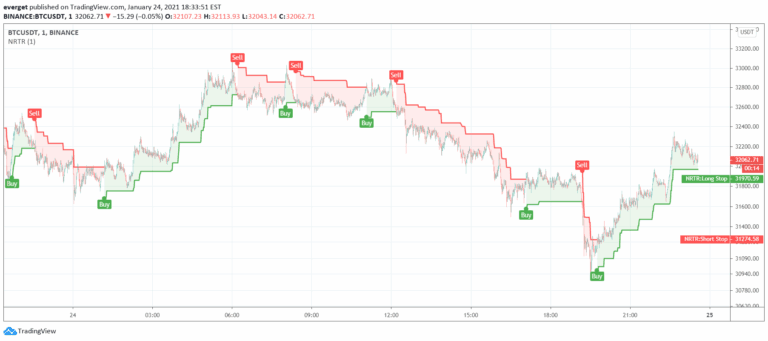
Nick Rypock Trailing Reverse (NRTR)
Nick Rypock Trend Reversal (NRTR) is a dynamic price channel indicator that tracks trend direction by measuring price extremes and percentage deviation from peak or bottom.
Explore 11,183 indicators. Filter beyond the obvious.
Discover the tools that fit the way you trade.
11,183 tools to explore
Nick Rypock Trend Reversal (NRTR) is a dynamic price channel indicator that tracks trend direction by measuring price extremes and percentage deviation from peak or bottom.
A unique trading indicator combining Murrey Math formulas with Fibonacci retracement levels to identify potential market tops, bottoms, and long-term trend dynamics with enhanced precision.
A market structure indicator that detects breaker blocks, extending swing levels and highlighting potential support/resistance zones through price interactions and breakout events.
A meme-inspired trading indicator that identifies a McDonald's logo-shaped pattern using cubic Bezier curves, detecting specific market tops and bottoms with a unique visual representation.
A comprehensive indicator that scans and highlights multiple reversal chart patterns like Double Tops, Cup and Handles, and Head and Shoulders using recursive zigzag analysis.
A market analysis tool that calculates probabilities of price tops and bottoms across various time periods, offering traders strategic insights into market timing and potential trend reversals.
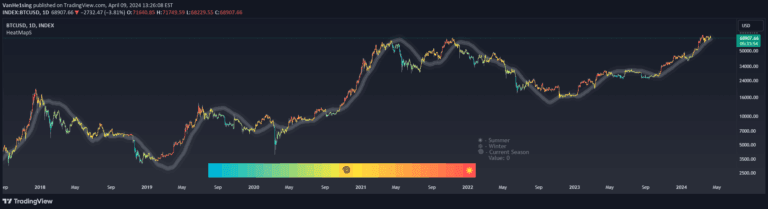
Heat Map Seasons indicator visualizes market dynamics through seasonal trends, using regression analysis and color-coded heat map to highlight market volatility and potential sentiment shifts.
Top G Indicator helps traders identify market extremes by spotting high-probability tops and bottoms using dynamic range analysis and momentum shifts.
A long-term market cycle indicator that compares short and long moving averages to identify potential market tops and bottoms, especially for assets like Bitcoin.
A technical analysis indicator using Fibonacci levels and key moving averages to identify market tops, bottoms, and trend directions for precise entry and exit points in trading.
A comprehensive Bitcoin market cycle analysis tool using multiple on-chain metrics to track long-term price behavior, identify market cycles, and forecast potential price movements.
MVRV Z-Score analyzes Bitcoin's market value and realized value to identify potential market tops and bottoms by measuring valuation extremes.
Likes, views, and comments are historical TradingView snapshots. They describe attention, not trading performance.