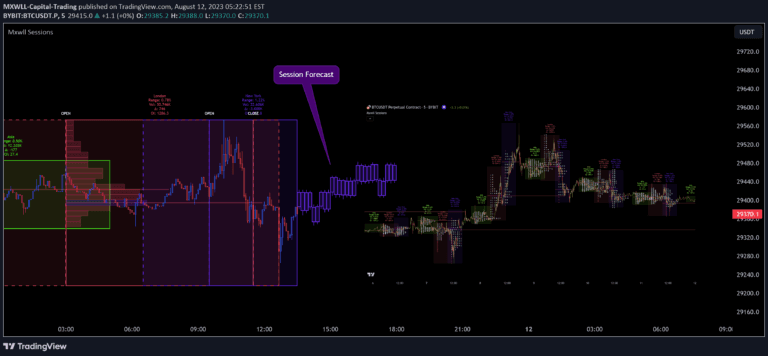
A real-time TPO Market Profile indicator that tracks price distribution and market activity across different timeframes, providing traders with visual insights into market structure and trading sessions.
Explore complementary indicator rolesHow it works
The TPO Market Profile indicator calculates price levels and appends letters representing trading activity within each time segment. It dynamically updates based on selected timeframe, tracking price distribution and market structure.
The script generates a visual representation of price movement, marking the point of control (POC), value area high (VAH), and value area low (VAL). It automatically adjusts to different timeframes from 1 second to longer intervals. Letters are assigned progressively to show trading activity, creating a comprehensive market profile visualization
Why it may be useful
The TPO Market Profile helps traders understand market dynamics by revealing price acceptance and rejection levels. It provides insights into market sentiment, identifying areas of high trading activity and potential support/resistance zones.
Traders can quickly assess market structure, recognize value areas, and make more informed trading decisions. The indicator offers a unique perspective on price distribution, helping to identify potential entry and exit points. It transforms complex market data into an easy-to-understand visual representation
When to explore it
The TPO Market Profile is most effective during periods of consistent trading activity, particularly in liquid markets like cryptocurrencies and major stock indices. It works best on timeframes of 1 minute or higher, allowing sufficient data accumulation.
Traders can use it to analyze market sessions, identify potential trend reversals, and understand market sentiment. It's particularly useful for day traders and swing traders seeking to understand price behavior and market structure. The indicator helps in recognizing areas of price acceptance and potential breakout zones
Keep exploring
What we’ve verified
Access, alerts and repainting behaviour have not been independently verified for this indicator. Check the creator’s current publication and settings.
General descriptions and classifications are recovered research. Verified details above identify the specific checks we have completed. Check the creator’s current publication for later changes.