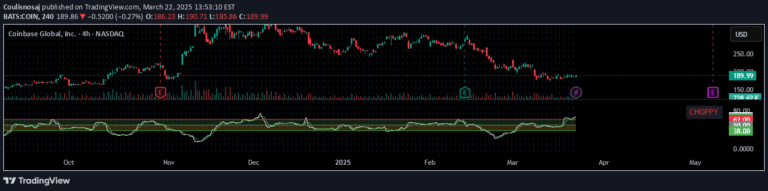
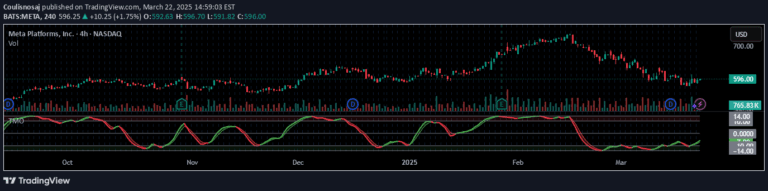
A trend indicator using EMA and 30SMA to help traders identify short-term market direction and potential entry points with color-coded trend signals.
Explore complementary indicator rolesHow it works
The indicator uses Exponential Moving Average (EMA) to assess short-term trends, with a color-coded system indicating market direction: green for long, red for short, and blue for neutral. It employs a 30 Simple Moving Average (SMA) as the default trend line, complemented by an Average True Range (ATR) band to expand the judgment scope.
Traders can identify potential entry points by observing the 30SMA slope and ATR band. When the SMA slope is positive (greater than 45 degrees), it suggests a bullish market. The EMA color change to green indicates a favorable short-term trend, signaling a potential entry point for traders.
Why it may be useful
This trend indicator simplifies market analysis by providing a clear, visual representation of short-term and overall market trends. By combining EMA and SMA with a color-coded system, traders can quickly assess market direction and momentum without complex calculations.
The inclusion of the ATR band adds an extra layer of confirmation, helping traders identify potential entry points with greater confidence. This approach reduces emotional decision-making and provides a structured method for trend identification, making it valuable for traders seeking a straightforward trend analysis tool.
When to explore it
The indicator is most effective in markets with clear trending conditions, particularly during periods of sustained bullish or bearish momentum. It works best in timeframes that capture short-term price movements, such as intraday and scalping scenarios.
Traders should use this tool in conjunction with other technical analysis methods to confirm signals and validate entry points. It is particularly useful in markets with consistent directional movement, such as forex, cryptocurrencies, and actively traded stocks with strong trend characteristics.
Keep exploring
What we’ve verified
Access, alerts and repainting behaviour have not been independently verified for this indicator. Check the creator’s current publication and settings.
General descriptions and classifications are recovered research. Verified details above identify the specific checks we have completed. Check the creator’s current publication for later changes.