
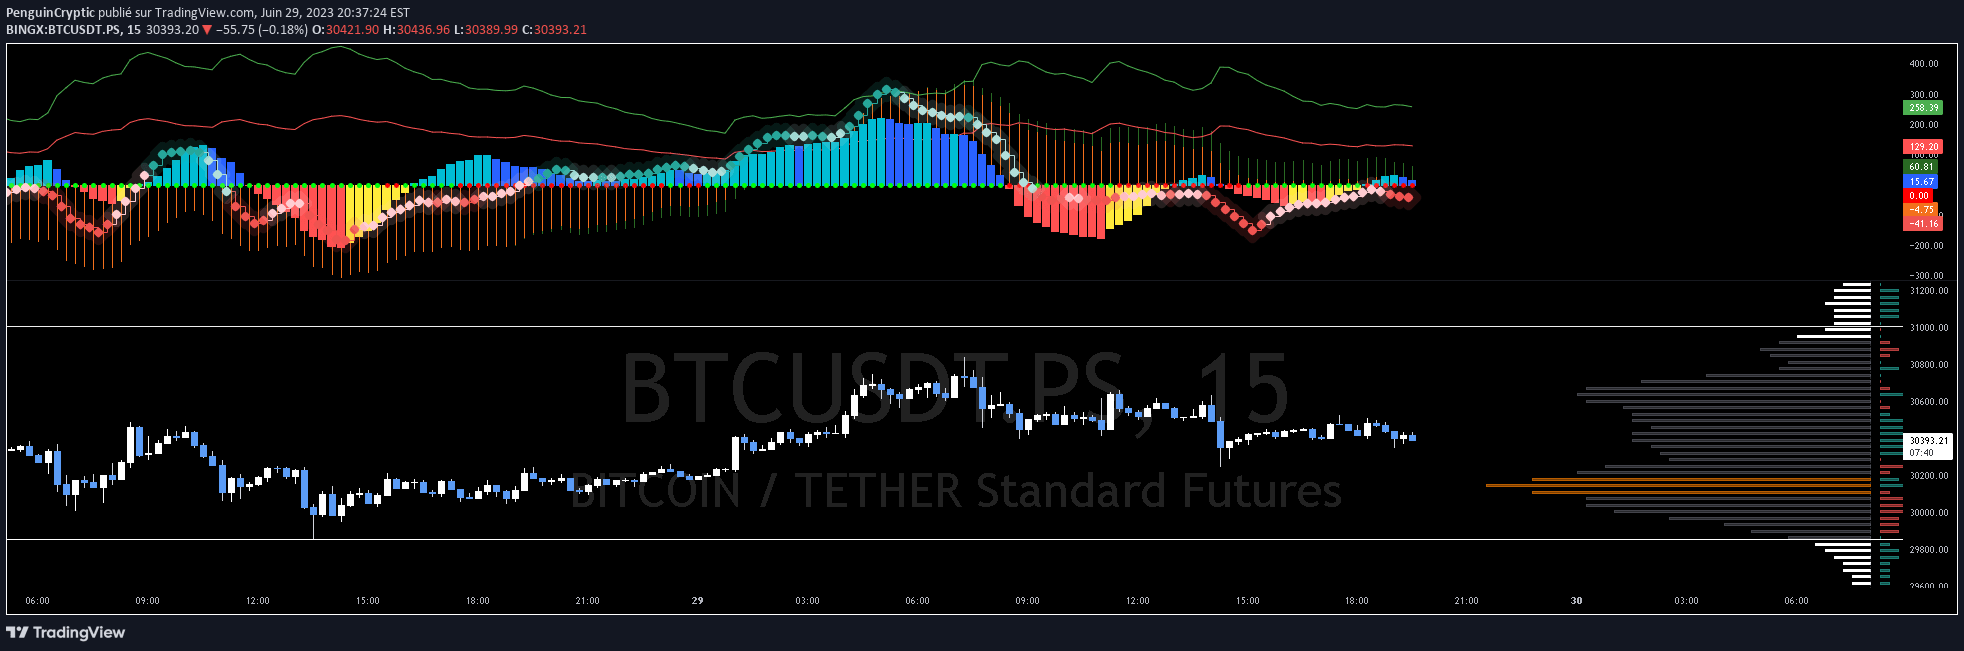
A multi-indicator trading signal combining Awesome Oscillator, Momentum, ATR, Squeeze, and Wave analysis to identify potential market trends, reversals, and volatility shifts.
Explore complementary indicator rolesHow it works
This trading signal integrates multiple technical indicators to provide a comprehensive market analysis. The Awesome Oscillator (AO) identifies potential trend reversals by measuring market momentum, while the Momentum indicator tracks the speed of price changes. The Average True Range (ATR) measures price volatility and helps set stop-loss and take-profit levels.
The TTM Squeeze and Wave indicators further enhance the signal's precision by detecting potential volatility breakouts and analyzing recent price movements. By combining these indicators, traders can gain insights into market dynamics, trend strength, and potential directional changes across different timeframes.
Why it may be useful
This multi-indicator approach provides traders with a more holistic view of market conditions, reducing the likelihood of false signals that might occur when relying on a single indicator. By integrating momentum, volatility, and trend analysis, traders can make more informed decisions about market entry and exit points.
The comprehensive nature of this signal allows traders to adapt to different market conditions, whether experiencing trending or choppy markets. It offers flexibility across various trading styles and timeframes, making it a versatile tool for traders seeking to improve their market analysis and decision-making process.
When to explore it
This trading signal is most effective in markets with clear directional movements and moderate volatility. Traders should pay special attention to signals when multiple indicators align, suggesting a stronger probability of a potential market move. It works particularly well during periods of market transition, such as when shifting from a consolidation phase to a trending market.
Ideal usage includes analyzing multiple timeframes to confirm signals and combining this indicator with other technical and fundamental analysis tools. Traders should be cautious during extremely low volatility periods or during major economic announcements that can create unpredictable market movements.
Keep exploring
What we’ve verified
Access, alerts and repainting behaviour have not been independently verified for this indicator. Check the creator’s current publication and settings.
General descriptions and classifications are recovered research. Verified details above identify the specific checks we have completed. Check the creator’s current publication for later changes.


