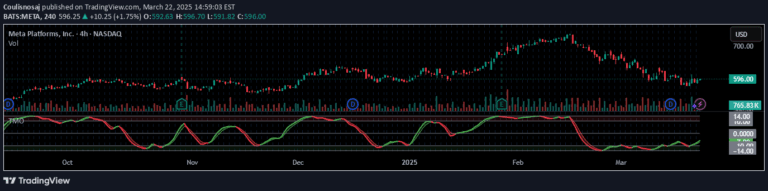
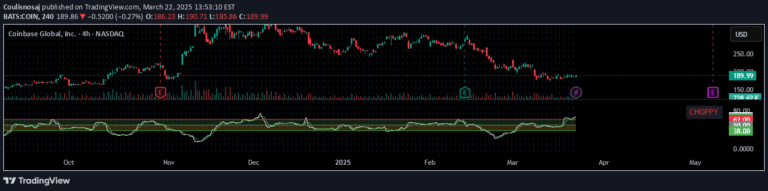
Custom momentum indicator that tracks market trends by calculating complex momentum values and generating buy/sell signals based on price movement and market squeeze conditions.
Explore complementary indicator rolesHow it works
The Worm indicator calculates momentum through a series of complex mathematical transformations of price data, creating multiple momentum lines (L0, L1, L2, L3) that track market movement. It uses advanced calculations involving source price data to generate a dynamic momentum representation, integrating multiple technical analysis components like Bollinger Bands and Keltner Channels.
The indicator determines market conditions by analyzing the relationship between these momentum lines and identifying squeeze conditions, which represent periods of compressed market volatility. By comparing these calculated values, the indicator generates color-coded signals that help traders understand potential trend shifts and momentum changes in real-time.
Why it may be useful
The Worm indicator provides traders with a nuanced view of market momentum, offering insights beyond traditional single-dimensional momentum measurements. By integrating multiple calculation methods and technical analysis tools, it creates a comprehensive perspective on price movement that can help traders identify potential trend reversals and market transitions more effectively.
Its unique approach of combining momentum calculations with volatility squeeze detection allows traders to understand not just the direction of price movement, but also the underlying market dynamics and potential energy for future price changes.
When to explore it
The Worm indicator is most effective in markets with clear momentum trends and during periods of potential volatility expansion after compression. Traders can utilize this indicator in more volatile markets like cryptocurrency, forex, and actively traded stock indices where rapid momentum shifts are common.
It works best when combined with other confirmatory technical analysis tools, particularly in timeframes ranging from minutes to hours. Traders should pay special attention to color changes and crossover signals, using them as potential entry or exit points in their trading strategies.
Keep exploring
What we’ve verified
Access, alerts and repainting behaviour have not been independently verified for this indicator. Check the creator’s current publication and settings.
General descriptions and classifications are recovered research. Verified details above identify the specific checks we have completed. Check the creator’s current publication for later changes.