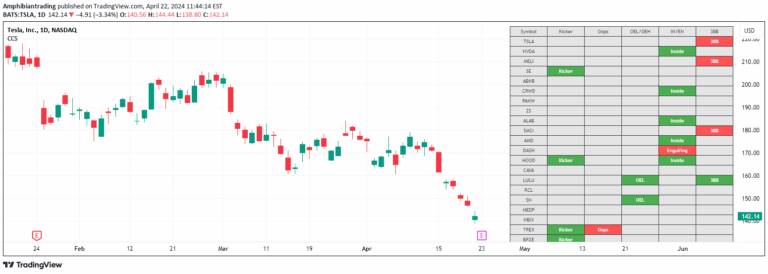
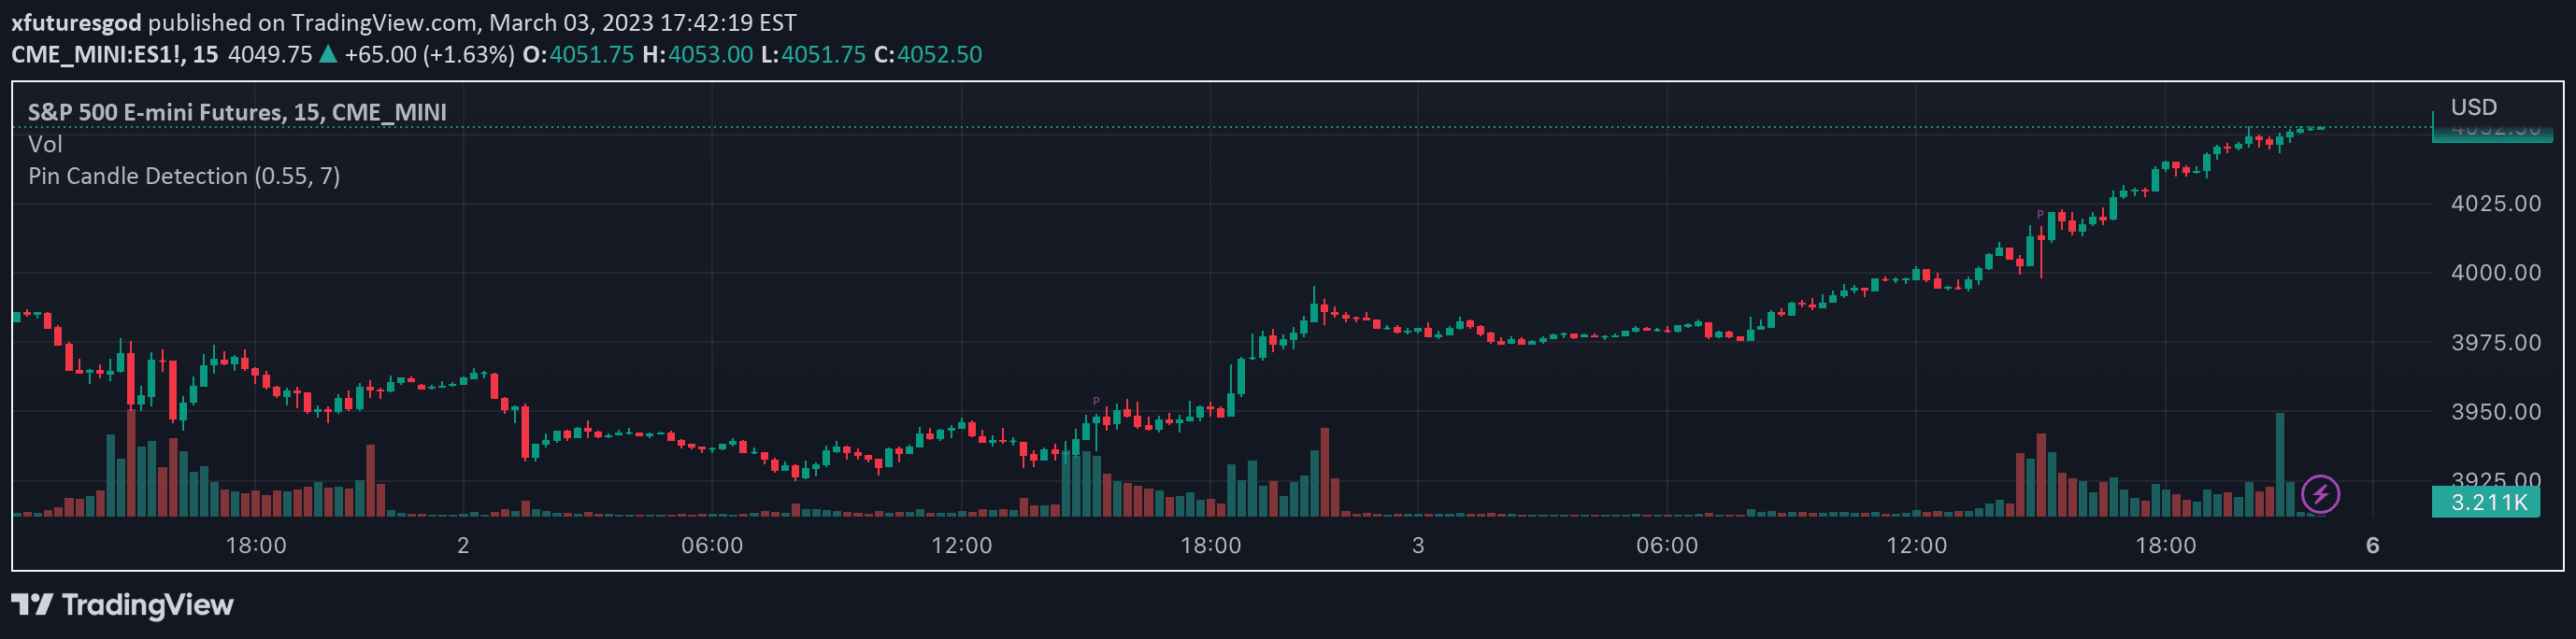
A price action indicator that identifies two-candle reversal patterns by highlighting potential high and low points through specific bullish and bearish candle sequences.
Explore complementary indicator rolesHow it works
The indicator operates by identifying specific two-candle sequences that suggest potential price reversals. For a high pattern, it looks for a bullish candle immediately followed by a bearish candle, with the bearish candle marking the highest price point of the two-candle sequence.
Conversely, for a low pattern, the indicator seeks a bearish candle followed by a bullish candle, where the bearish candle represents the lowest price level. Once these patterns are detected, horizontal lines are drawn at the respective high or low price points to visually highlight potential reversal zones.
Why it may be useful
This signal provides traders with a visual method to quickly identify potential trend reversal points in price action. By highlighting specific two-candle patterns, it helps traders recognize moments when market momentum might be shifting, allowing for more informed entry and exit decisions.
The horizontal lines drawn at high and low points serve as immediate visual reference for support and resistance levels, enabling traders to make quicker assessments about potential price movements and market sentiment without complex calculations.
When to explore it
The indicator works best in markets with clear and distinct price action, such as stocks, forex, and futures with moderate volatility. It is particularly effective in identifying short-term reversal opportunities where price momentum shows clear directional changes between consecutive candles.
Traders should use this signal in conjunction with other technical analysis tools to confirm potential trade setups, as the two-candle patterns alone might not always guarantee a reliable reversal. It is most suitable for shorter timeframes where price action is more dynamic and frequent.
Keep exploring
What we’ve verified
Access, alerts and repainting behaviour have not been independently verified for this indicator. Check the creator’s current publication and settings.
General descriptions and classifications are recovered research. Verified details above identify the specific checks we have completed. Check the creator’s current publication for later changes.