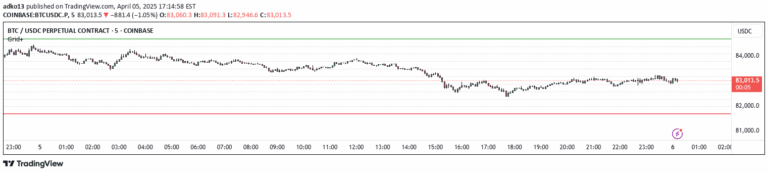
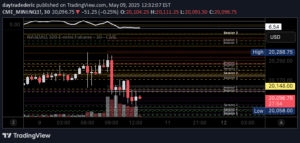
A technical indicator that calculates the midpoint of a significant candlestick to identify potential support/resistance levels and potential market breakout points.
Explore complementary indicator rolesHow it works
The long candle midpoint indicator works by analyzing a candlestick with significant price movement and calculating its precise midpoint. Traders set parameters like length, line extension, and calculation method to determine the midpoint's location on the chart.
The script then plots a horizontal line at this midpoint, which serves as a potential support or resistance level. By using different calculation methods such as Highest True Range, Average True Range, or a combination, traders can customize the indicator to suit their specific market analysis needs.
Why it may be useful
The long candle midpoint indicator provides traders with a strategic tool to understand potential market sentiment and identify key price levels. By highlighting the midpoint of significant price movements, it helps traders anticipate potential support and resistance zones that could influence future price action.
This indicator is particularly valuable because it transforms a single candlestick's price movement into a meaningful reference point. Traders can use this information to make more informed decisions about potential entry and exit points, ultimately improving their trading strategy's precision and effectiveness.
When to explore it
The long candle midpoint indicator is most effective in markets experiencing significant price movements and potential trend reversals. It works best when applied to timeframes that capture meaningful candlestick patterns, such as daily or hourly charts where substantial price changes are more likely to occur.
Traders should use this indicator in conjunction with other technical analysis tools to confirm potential breakout points. It is particularly useful in volatile markets or when analyzing stocks with strong momentum, where the midpoint can serve as a critical psychological level for traders.
Keep exploring
What we’ve verified
Access, alerts and repainting behaviour have not been independently verified for this indicator. Check the creator’s current publication and settings.
General descriptions and classifications are recovered research. Verified details above identify the specific checks we have completed. Check the creator’s current publication for later changes.