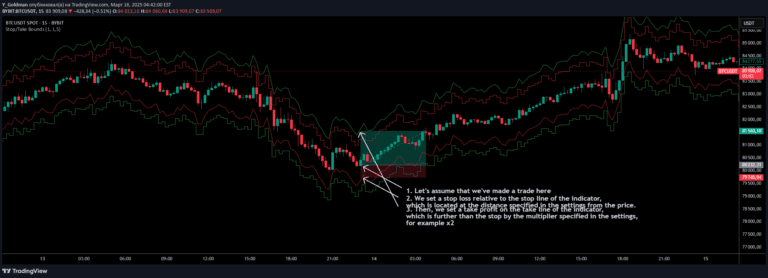
A dynamic trading tool that identifies upper and lower boundary levels for cryptocurrency pairs against BTC, helping traders spot potential overbought and oversold zones.
Explore complementary indicator rolesHow it works
The Upper and Lower Bound indicator calculates dynamic price boundaries using advanced statistical techniques like Z-Score or Bollinger Bands. It analyzes historical price movements and volatility to generate real-time resistance and support levels for cryptocurrency pairs traded against Bitcoin.
By continuously tracking price fluctuations, the indicator adjusts its boundaries dynamically, providing traders with adaptive insights into potential market zones. Users can customize parameters such as lookback periods and standard deviations to fine-tune the indicator's sensitivity and alignment with their specific trading strategy.
Why it may be useful
This indicator provides crucial market insights by visualizing potential overbought and oversold zones, which helps traders make more informed decisions about entry and exit points. By offering a structured approach to understanding price dynamics, it reduces emotional trading and promotes a more systematic investment strategy.
The tool's dynamic nature allows traders to adapt quickly to changing market conditions, minimizing risk and maximizing potential opportunities. Its ability to generate objective boundaries helps traders develop more disciplined and data-driven trading approaches across different cryptocurrency pairs.
When to explore it
The Upper and Lower Bound indicator is most effective during periods of moderate to high market volatility in cryptocurrency markets, particularly when trading pairs against Bitcoin. It works best when traders want to identify potential trend reversals or breakout points with greater precision and statistical confidence.
Traders should utilize this indicator when seeking to implement risk management strategies, validate potential trade setups, or gain deeper insights into market sentiment. It is particularly useful for traders who prefer a systematic, data-driven approach to analyzing cryptocurrency price movements and identifying strategic entry and exit points.
Keep exploring
What we’ve verified
Access, alerts and repainting behaviour have not been independently verified for this indicator. Check the creator’s current publication and settings.
General descriptions and classifications are recovered research. Verified details above identify the specific checks we have completed. Check the creator’s current publication for later changes.