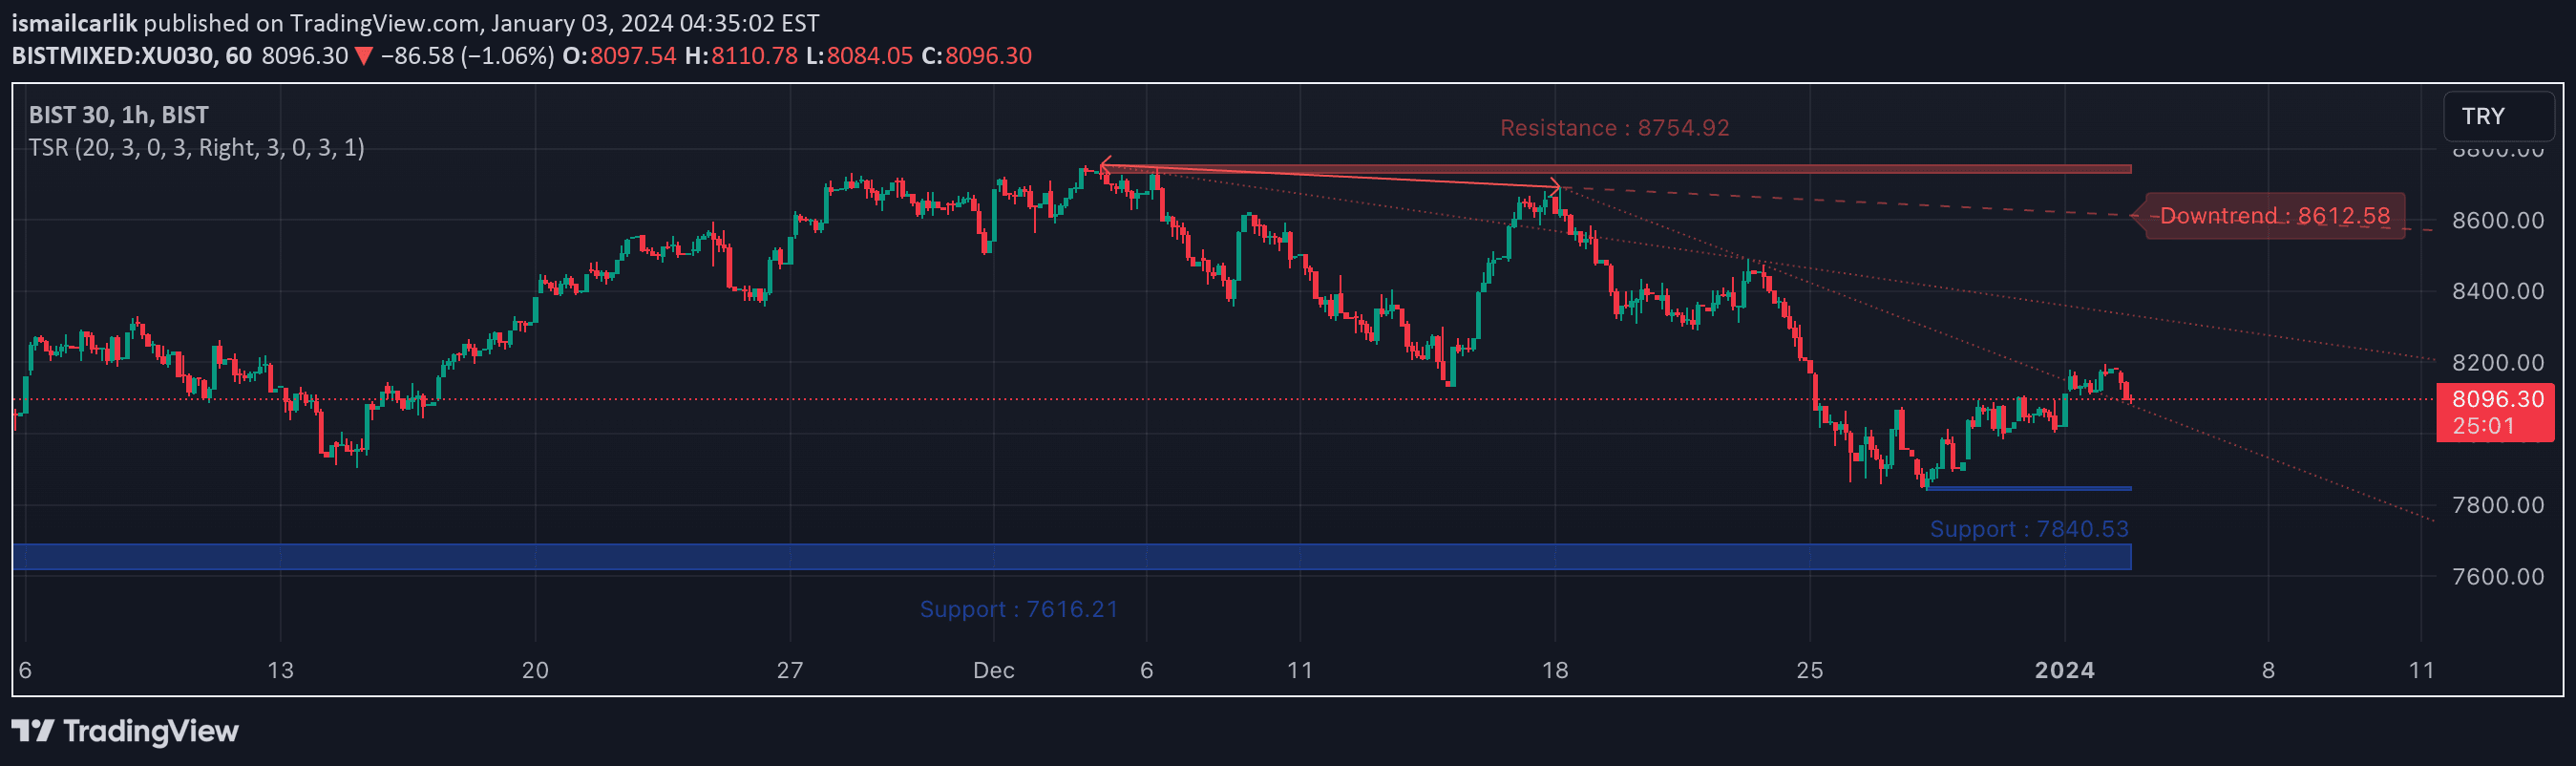
A dynamic technical analysis tool that automatically identifies and visualizes recent support and resistance levels based on pivot points within a specified range of price bars.
Explore complementary indicator rolesHow it works
The indicator calculates pivot points by analyzing price highs and lows within a specified range, typically set to 50 bars. It identifies pivot highs as bars with higher highs than surrounding bars, and pivot lows as bars with lower lows than surrounding bars.
When a new pivot low is detected, it creates a green horizontal support line starting from that point and extending to the current bar. Similarly, when a new pivot high is found, it draws a red horizontal resistance line. These lines dynamically update, replacing previous support and resistance levels to reflect the most recent market conditions.
Why it may be useful
Support and resistance levels are crucial for understanding market psychology and potential price reversal points. This indicator provides traders with an automated, visually clear method of tracking these critical levels, helping them make more informed trading decisions.
By dynamically adapting to the most recent price action, the tool offers real-time insights into potential entry and exit points. Traders can quickly identify key price levels where the market has previously shown buying or selling pressure, which can be instrumental in developing more strategic trading approaches.
When to explore it
This indicator is most effective in markets with clear trending or ranging behaviors, where support and resistance levels play a significant role in price movement. It works particularly well for traders who rely on visual cues and want to quickly identify potential price turning points.
The tool is especially useful in volatile markets where rapid price changes can obscure traditional support and resistance levels. Traders can benefit from its dynamic nature across various timeframes, from scalping to swing trading, making it a versatile tool for different trading styles and market conditions.
Keep exploring
What we’ve verified
Access, alerts and repainting behaviour have not been independently verified for this indicator. Check the creator’s current publication and settings.
General descriptions and classifications are recovered research. Verified details above identify the specific checks we have completed. Check the creator’s current publication for later changes.