
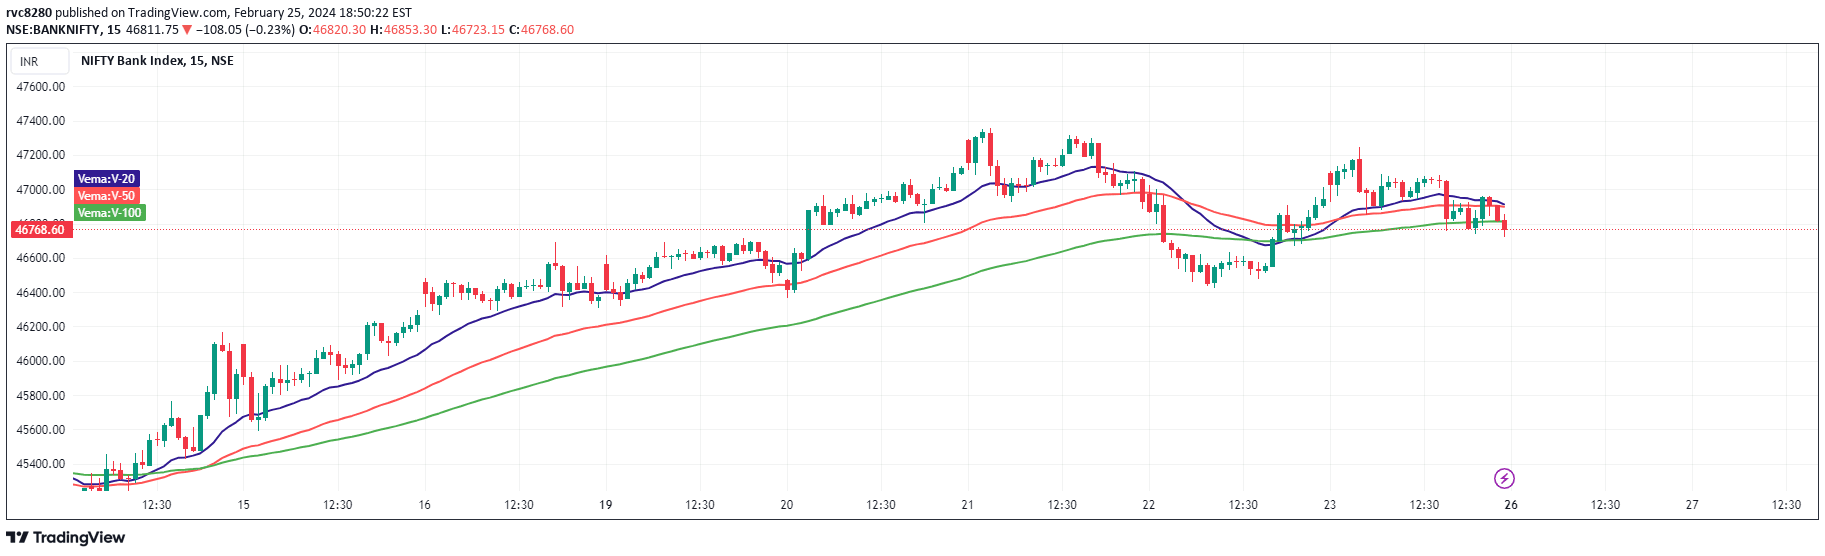
VEMA is a volume-weighted indicator using moving averages of close prices at the highest volume candles, providing trend insights across multiple timeframes.
Explore complementary indicator rolesHow it works
The VEMA indicator calculates moving averages specifically on candles with the highest trading volume, focusing on price action during most significant market moments. It creates three distinct lines at 20, 50, and 100 periods, representing different trend perspectives based on volume-weighted close prices.
These moving average lines help traders identify trend direction and potential trend changes by highlighting price movements during periods of highest market participation. By prioritizing high-volume candles, the VEMA provides a more refined view of market sentiment compared to traditional moving averages.
Why it may be useful
The VEMA indicator offers traders a more nuanced understanding of market trends by emphasizing price movements during high-volume periods. It helps filter out noise from low-volume candles, providing a clearer signal of potential trend shifts and market momentum.
By focusing on volume-weighted data, traders can gain insights into the strength and reliability of price movements. This approach helps distinguish between genuine trend developments and temporary price fluctuations, enabling more informed trading decisions.
When to explore it
The VEMA indicator works best in markets with consistent volume and clear trend characteristics, such as major currency pairs, stock indices, and liquid commodities. Traders can utilize this indicator during periods of steady market activity where volume provides meaningful trend confirmation.
It is particularly effective for short to medium-term trading strategies, especially in markets with predictable volume patterns. Traders should combine VEMA with other technical analysis tools to validate signals and improve overall trading accuracy.
Keep exploring
What we’ve verified
Access, alerts and repainting behaviour have not been independently verified for this indicator. Check the creator’s current publication and settings.
General descriptions and classifications are recovered research. Verified details above identify the specific checks we have completed. Check the creator’s current publication for later changes.


