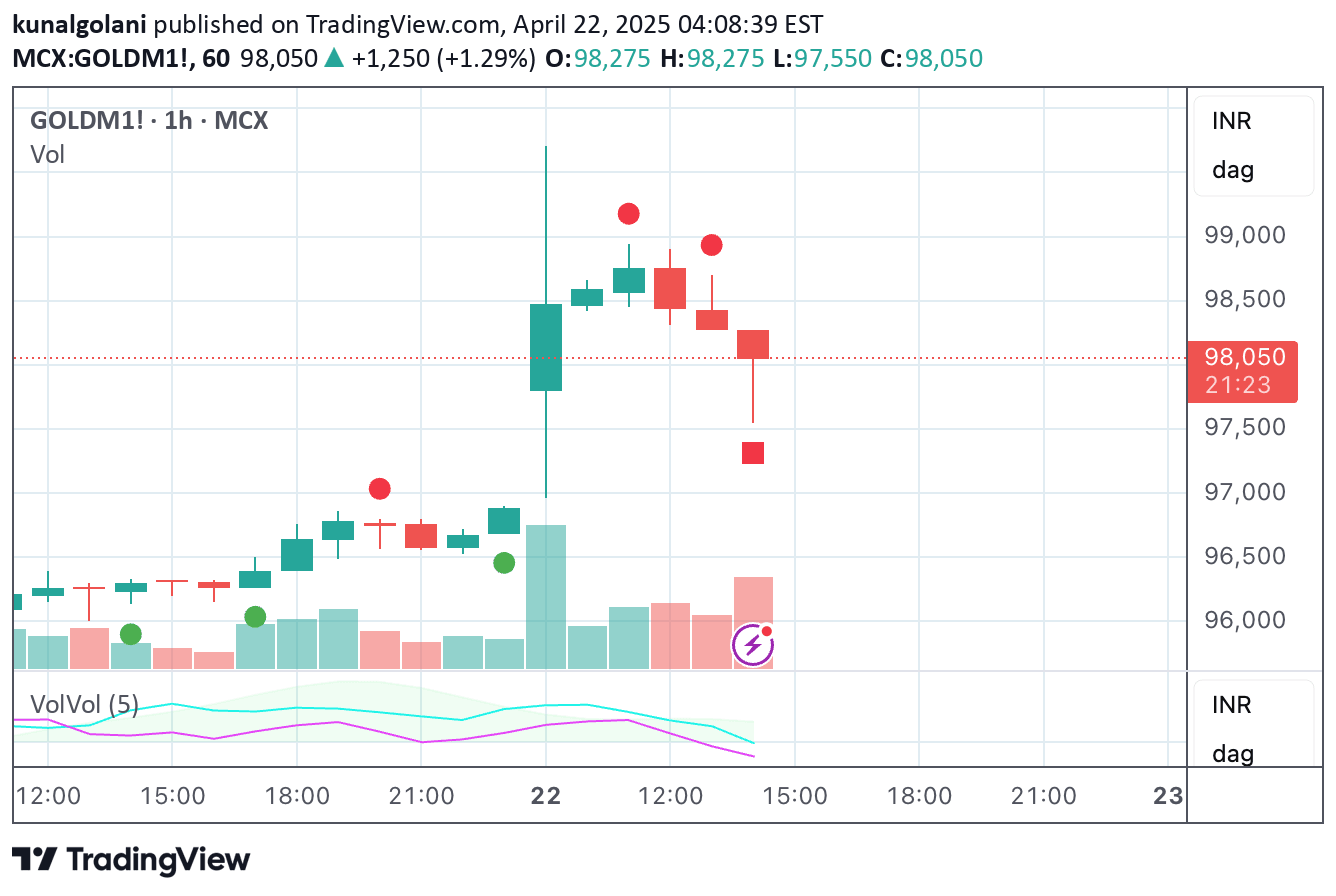
A trading indicator that divides trading volume by open interest to reveal the average position size and help understand the nature of market participants.
Explore complementary indicator rolesHow it works
The Volume to Open Interest (VOI) indicator calculates the ratio between total trading volume and current open interest in a financial instrument. By dividing the volume by open interest, traders can determine the average size of trading positions currently active in the market. This calculation provides insight into the type of market participants engaged in trading, whether they are large institutional investors or smaller retail traders.
The indicator helps traders understand the relative strength and commitment of market participants by revealing how much volume is being traded relative to the total number of outstanding contracts or positions. A higher ratio might suggest more active trading by larger players, while a lower ratio could indicate more conservative or smaller-scale trading activity.
Why it may be useful
Understanding the relationship between volume and open interest is crucial for traders seeking to gauge market sentiment and potential price movements. This indicator allows traders to differentiate between significant institutional trading and smaller retail participation, which can provide valuable context for potential market trends and momentum.
By revealing the average position size, traders can better assess the overall market dynamics and potential market pressure. The Volume to Open Interest ratio helps traders make more informed decisions by offering a unique perspective on market participation. It can signal potential changes in market sentiment, reveal the level of commitment from different types of traders, and provide additional context for interpreting price movements and potential trend reversals.
When to explore it
The Volume to Open Interest indicator is most effective in markets with significant liquidity and transparent trading data, such as futures, options, and certain heavily traded stocks. Traders should use this indicator in conjunction with other technical and fundamental analysis tools to confirm market insights and potential trading signals.
It works best during periods of active trading and when there are clear trends or potential trend reversals. This indicator is particularly useful for traders looking to understand the underlying market dynamics and the nature of market participants. It can be especially valuable during key market events, earnings announcements, or periods of significant economic news that might attract different types of traders and investors.
Keep exploring
What we’ve verified
Access, alerts and repainting behaviour have not been independently verified for this indicator. Check the creator’s current publication and settings.
General descriptions and classifications are recovered research. Verified details above identify the specific checks we have completed. Check the creator’s current publication for later changes.