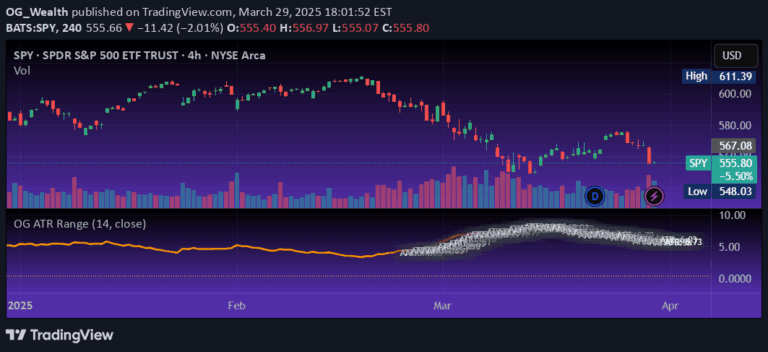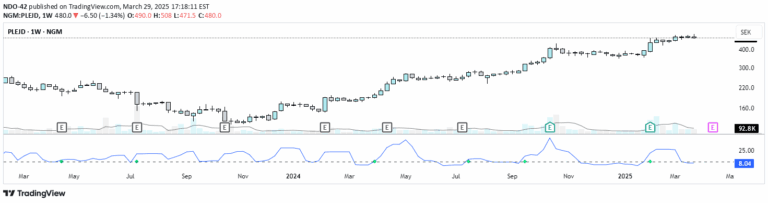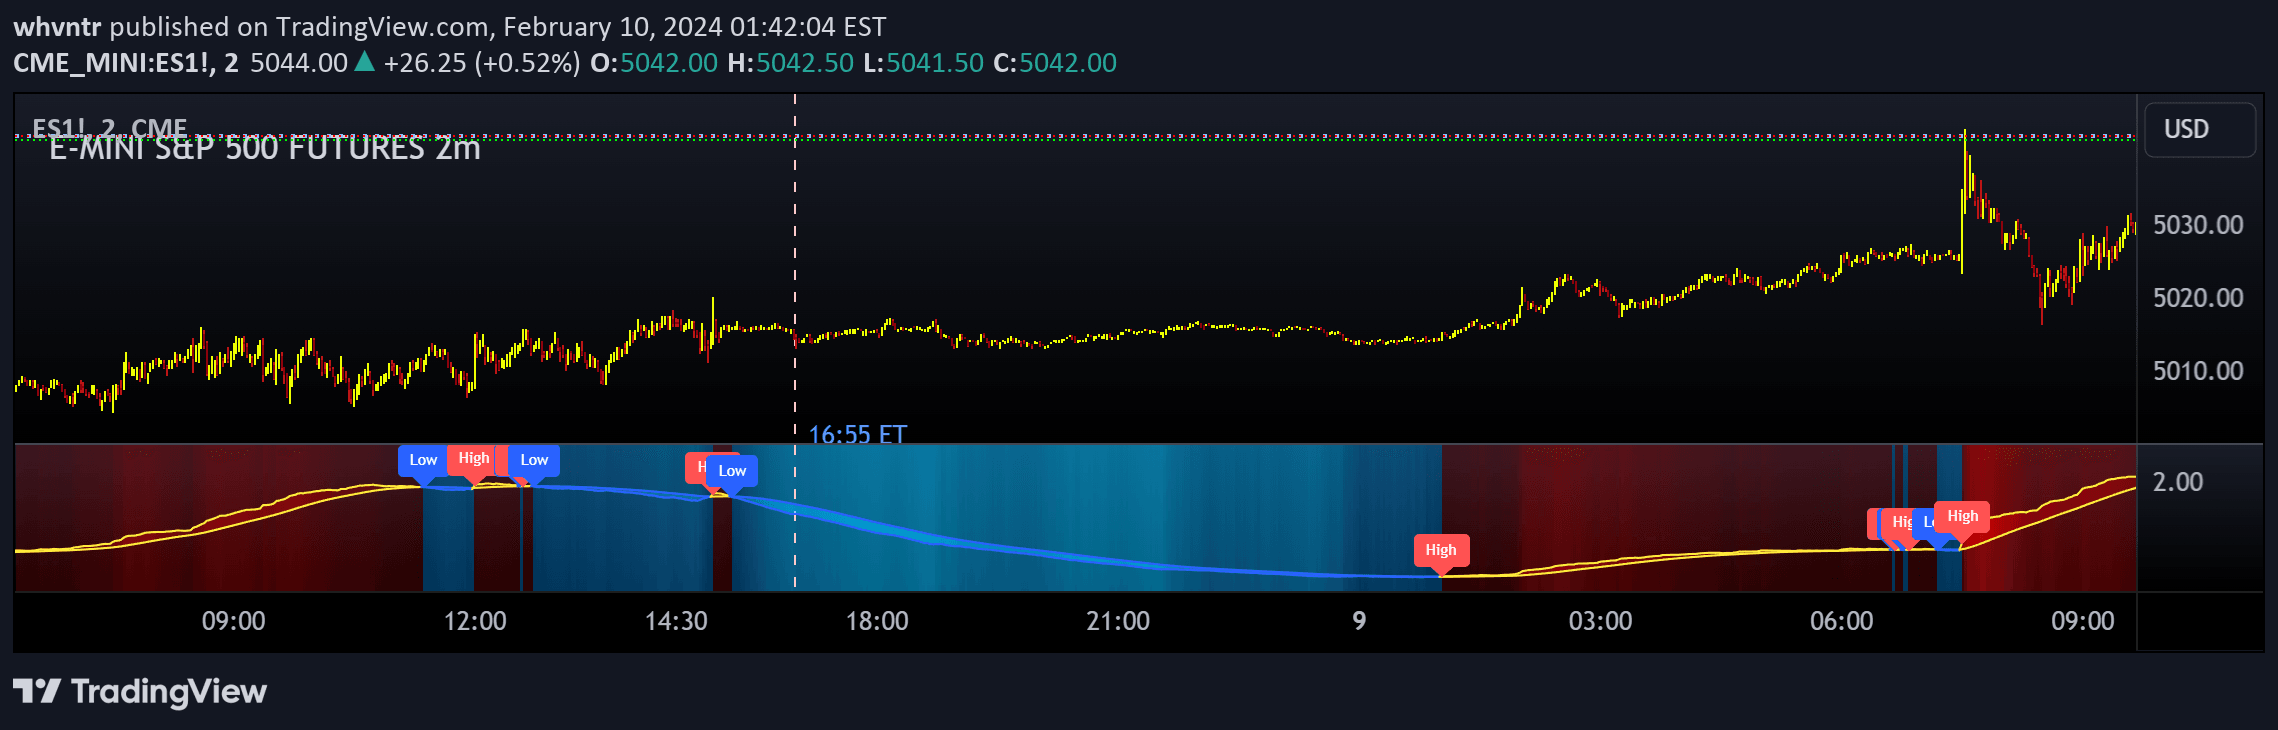
Volatility Spectrum is an advanced technical indicator that provides nuanced market volatility analysis through customizable Average True Range (ATR) measurements and dynamic visual representations.
Explore complementary indicator rolesHow it works
Volatility Spectrum operates by calculating the Average True Range (ATR) with enhanced flexibility, allowing traders to customize the analysis length and smoothing technique. It integrates standard ATR calculations with an average ATR, creating a more comprehensive view of market volatility by measuring price variations and potential market movements.
The indicator uses multiple smoothing methods like RMA, SMA, EMA, or WMA to adjust the ATR's responsiveness to market changes. By offering dynamic color gradients and configurable alert systems, the tool transforms raw volatility data into an intuitive visual representation that helps traders quickly interpret market conditions and potential price fluctuations.
Why it may be useful
Volatility Spectrum provides traders with a sophisticated tool for understanding market dynamics beyond traditional volatility measurements. By offering granular insights into price movements, it enables more precise risk management and helps traders develop more nuanced trading strategies across different market conditions.
The indicator's versatility allows traders to adapt their approach based on real-time volatility information, potentially improving decision-making processes. Its customizable features mean traders can tailor the tool to their specific trading style, making it a valuable asset for both short-term and long-term trading approaches.
When to explore it
Volatility Spectrum is most effective when traders need to assess market conditions across various financial instruments, including stocks, forex, and commodities. It provides critical insights during periods of market uncertainty, helping traders identify potential trend changes and manage risk more effectively.
The indicator is particularly useful during volatile market periods, such as economic announcements, earnings reports, or significant global events. Traders can leverage its dynamic visualization and alert systems to make more informed decisions, using it in conjunction with other technical analysis tools to develop comprehensive trading strategies.
Keep exploring
What we’ve verified
Access, alerts and repainting behaviour have not been independently verified for this indicator. Check the creator’s current publication and settings.
General descriptions and classifications are recovered research. Verified details above identify the specific checks we have completed. Check the creator’s current publication for later changes.