
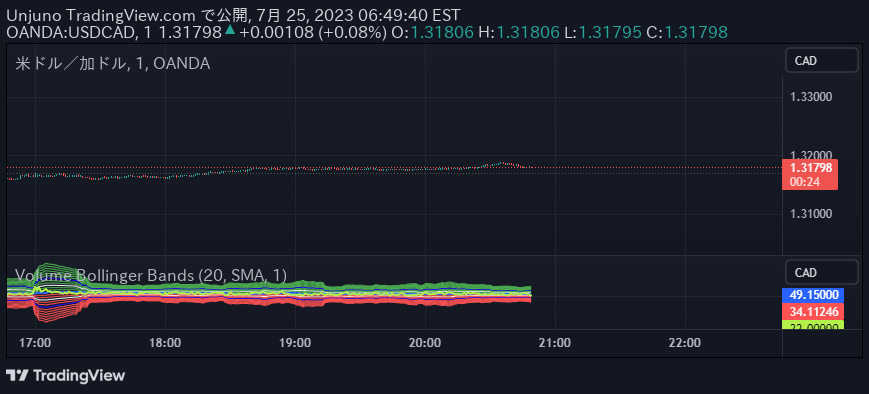
A custom volume indicator using Bollinger Bands to visualize volume trends, volatility, and potential price movements through moving average and standard deviation calculations.
Explore complementary indicator rolesHow it works
The Volume Bollinger Bands indicator calculates a moving average of volume data using user-selected methods like SMA, EMA, or WMA. It then computes standard deviation bands around this moving average, creating upper and lower bands that represent volume volatility.
The basis line represents the volume's moving average, while green upper bands and red lower bands show deviations from this average. By adjusting deviation multipliers, traders can customize the sensitivity of the indicator to volume fluctuations and identify potential trend changes or breakout points.
Why it may be useful
Volume is a critical indicator of market sentiment and potential price movements, providing insights into the strength and conviction behind price trends. By visualizing volume through Bollinger Bands, traders can better understand market dynamics and potential trend reversals or confirmations.
The indicator helps traders identify periods of increased or decreased trading activity, which can signal potential market shifts. By showing volume volatility relative to its moving average, the indicator provides a more nuanced view of market participation and potential trading opportunities.
When to explore it
The Volume Bollinger Bands indicator is most effective during periods of significant market activity or potential trend changes. Traders can use it to confirm trend strength, identify potential breakouts, or detect divergences between price and volume.
It is particularly useful in volatile markets where volume can provide critical insights into market sentiment. Traders should pay special attention when volume moves beyond the upper or lower bands, as this might indicate potential trend reversals or significant market movements.
Keep exploring
What we’ve verified
Access, alerts and repainting behaviour have not been independently verified for this indicator. Check the creator’s current publication and settings.
General descriptions and classifications are recovered research. Verified details above identify the specific checks we have completed. Check the creator’s current publication for later changes.





