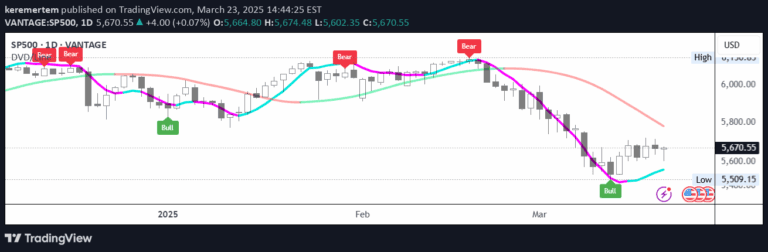
A trading indicator that calculates volume per price unit, revealing supply dynamics and potential price reversals or momentum through color-coded volume analysis.
Explore complementary indicator rolesHow it works
The indicator quantifies trading volume by measuring the amount of volume traded at each price level, creating a dynamic visual representation of market supply and demand. By calculating the volume per price unit, the script generates a color-coded visualization that helps traders understand the underlying market dynamics.
When the volume per price unit increases, it suggests higher supply at a specific price level, potentially indicating a potential trend reversal. Conversely, a decreasing volume value may signal reduced supply and hint at potential momentum or a breakout scenario in the market.
Why it may be useful
This volume-based signal provides traders with a nuanced perspective on market sentiment by revealing the distribution of trading volume across different price levels. By understanding the supply dynamics, traders can gain insights into potential trend reversals and momentum shifts that might not be immediately apparent from price action alone.
The color-coded visualization allows traders to quickly interpret market conditions, offering a visual representation of volume concentration and potential market turning points. This additional layer of analysis can help traders make more informed decisions about entry, exit, and risk management strategies.
When to explore it
The volume per price unit indicator is most effective in markets with clear trend movements and significant volume fluctuations, such as stocks, forex, and liquid futures contracts. Traders should use this signal in conjunction with other technical analysis tools to confirm potential trend reversals or momentum shifts.
It works best during periods of high trading activity and when there are noticeable changes in volume distribution across different price levels. Optimal usage includes identifying potential support and resistance zones, confirming breakouts, and assessing the strength of price movements through volume analysis.
Keep exploring
What we’ve verified
Access, alerts and repainting behaviour have not been independently verified for this indicator. Check the creator’s current publication and settings.
General descriptions and classifications are recovered research. Verified details above identify the specific checks we have completed. Check the creator’s current publication for later changes.