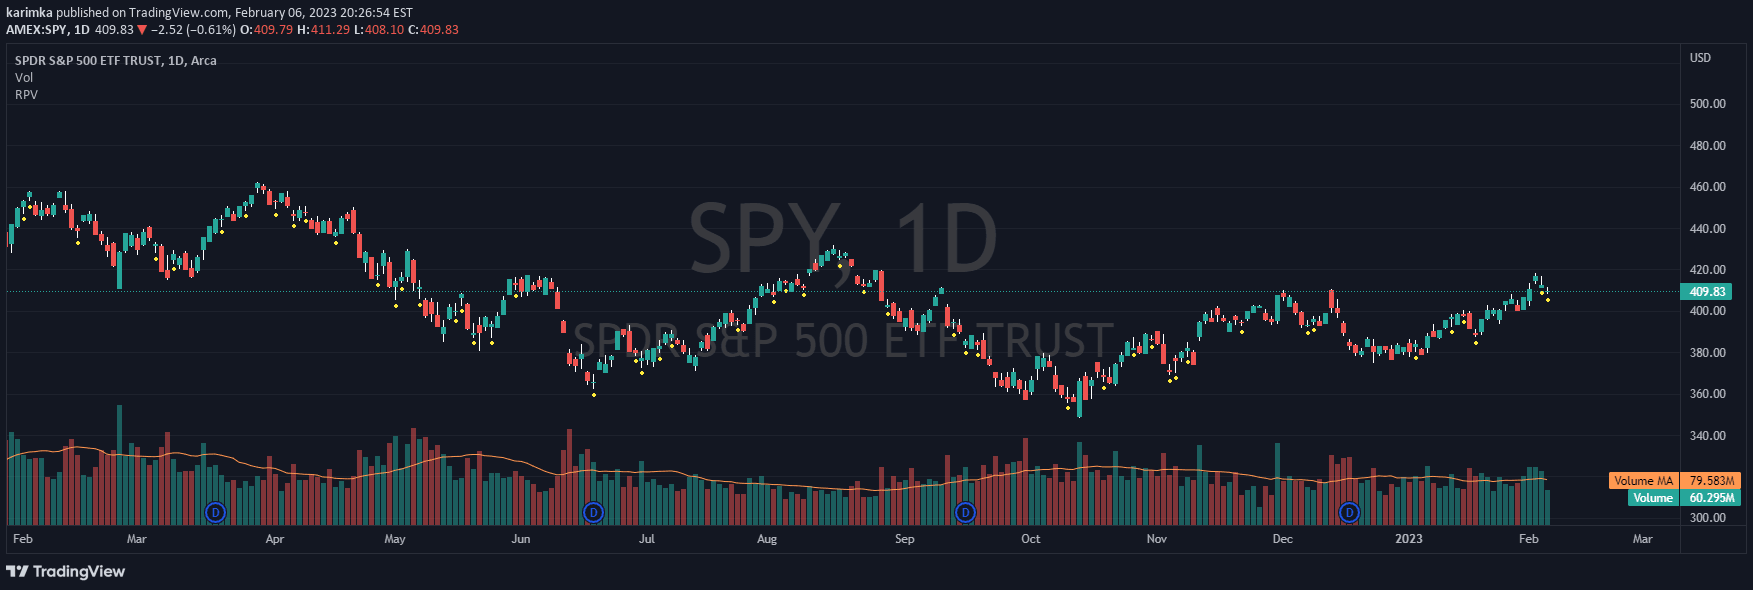
Aggressive Volume indicator simulates market buy/sell pressure by analyzing candle dynamics and volume, revealing trader sentiment and potential price movement trends.
Explore complementary indicator rolesHow it works
The Aggressive Volume indicator calculates simulated delta volume by examining each candle's direction and trading volume. It distinguishes between bullish and bearish candles, identifying which market participants are exerting more pressure during price movements.
By comparing buying and selling pressures, the indicator generates visual bars that represent the balance of market sentiment. Bullish candles with higher volume suggest stronger buyer dominance, while bearish candles indicate increased selling pressure, helping traders understand underlying market dynamics.
Why it may be useful
Aggressive Volume provides traders with a deeper understanding of market psychology by revealing the intensity of buying and selling activities. It goes beyond traditional volume analysis by simulating internal market pressure, offering insights into potential trend strength and momentum shifts.
The indicator helps traders make more informed decisions by highlighting subtle changes in market sentiment that might not be immediately apparent from price action alone. By quantifying the aggressiveness of market participants, traders can better anticipate potential trend continuations or reversals.
When to explore it
Traders should utilize Aggressive Volume during trending markets to confirm the strength of existing price movements. Strong positive delta during bullish trends can validate the ongoing momentum, while weakening delta might signal potential trend exhaustion or impending reversal.
The indicator is particularly useful when combined with other technical analysis tools like trend indicators or price action patterns. By cross-referencing Aggressive Volume with additional confirmation signals, traders can improve their entry and exit strategies across various trading timeframes.
Keep exploring
What we’ve verified
Access, alerts and repainting behaviour have not been independently verified for this indicator. Check the creator’s current publication and settings.
General descriptions and classifications are recovered research. Verified details above identify the specific checks we have completed. Check the creator’s current publication for later changes.