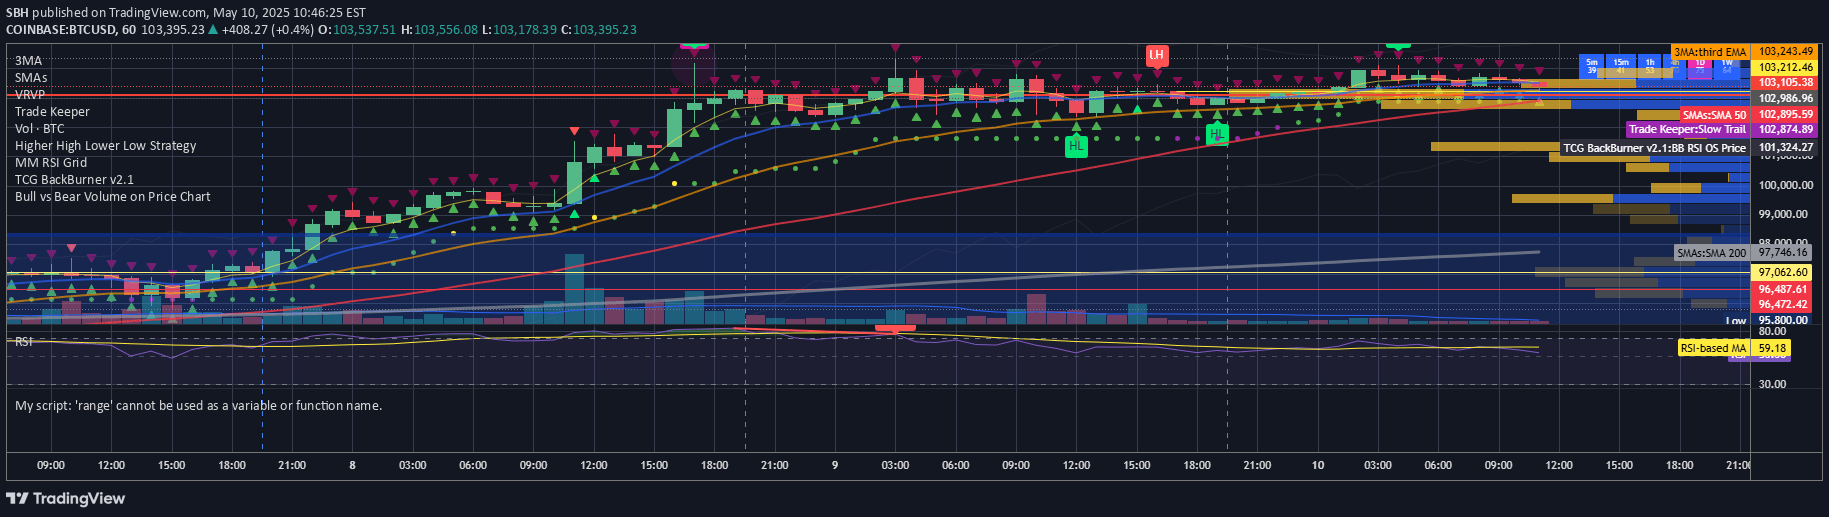
A volume indicator that calculates trading volume in dollar terms, providing visual representation of market activity through color-coded bars and dynamic volume labels.
Explore complementary indicator rolesHow it works
The Volume Indicator computes dollar-based volume by multiplying each candle's closing price with its trading volume, creating a standardized measure of market activity. This calculation transforms raw volume data into a more meaningful representation by expressing trading volume in monetary terms.
The indicator applies color coding to enhance visual interpretation, with standard bars displayed in blue and the highest volume bars within the last 10 periods highlighted in red. Dynamic labels are automatically added to peak volume bars, showing dollar amounts in millions or billions with precise formatting to improve readability and quick understanding.
Why it may be useful
The dollar-volume representation provides traders with a more comprehensive view of market dynamics by translating trading volume into a standardized monetary metric. This approach allows for better assessment of the real economic significance of price movements, beyond simple volume count.
By highlighting significant trading activity through color and labels, the indicator helps traders quickly identify periods of intense market participation and potential trend confirmation or reversal points. The automatic label positioning ensures clear visualization without sacrificing critical information.
When to explore it
This volume indicator is most effective during periods of market transitions, such as potential trend reversals or breakout scenarios where volume can provide critical confirmation signals. Traders can use it to validate price movements by observing whether significant price changes are accompanied by substantial dollar volume.
The indicator is particularly useful in both high and low volatility environments, offering insights across different market conditions. It can help traders distinguish between meaningful price movements backed by substantial trading activity and potentially less significant price changes with minimal economic engagement.
Keep exploring
What we’ve verified
Access, alerts and repainting behaviour have not been independently verified for this indicator. Check the creator’s current publication and settings.
General descriptions and classifications are recovered research. Verified details above identify the specific checks we have completed. Check the creator’s current publication for later changes.