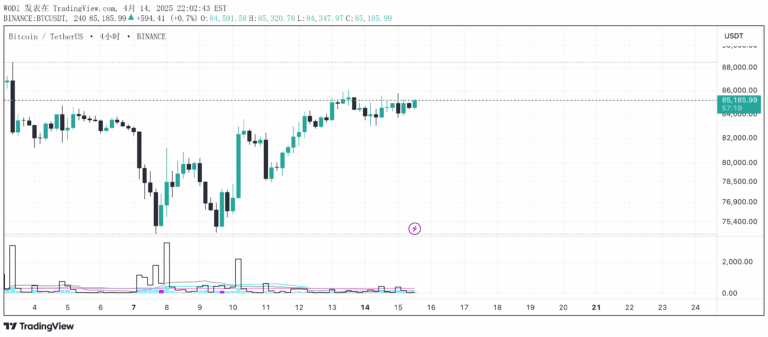
Volume Spectrum analyzes trading volume patterns across financial markets, offering insights into volume dynamics and potential price movement trends.
Explore complementary indicator rolesHow it works
The Volume Spectrum indicator calculates and compares trading volume across different time periods using customizable moving average methods. It first determines a user-defined volume length and a shorter-term average volume length, then applies selected smoothing techniques like RMA, SMA, EMA, or WMA to analyze volume trends.
By comparing these volume measurements, the indicator generates visual representations of volume dynamics, including optional volume histograms that indicate volume increases and price movement relationships. The tool highlights periods of high and low volume relative to historical averages, enabling traders to quickly identify potential trading signals and volume-based market conditions.
Why it may be useful
Volume Spectrum provides traders with critical insights into market sentiment and potential price movement dynamics by analyzing trading volume patterns. It helps traders understand the strength and momentum behind price changes by revealing periods of significant market interest or potential trend reversals.
The indicator's flexibility in customization allows traders to adapt the tool to their specific trading strategies and market preferences. By offering multiple smoothing methods, volume length options, and visual alerts, traders can gain deeper understanding of market conditions and make more informed trading decisions.
When to explore it
The Volume Spectrum indicator is most effective in markets with clear volume trends and significant price movements, such as stocks, forex, commodities, and cryptocurrencies. It works best when traders want to confirm trend strength, identify potential entry and exit points, and understand underlying market dynamics.
Traders should utilize this indicator during periods of market transition, when volume patterns might signal upcoming price changes or trend reversals. It is particularly useful in both bullish and bearish market conditions, helping traders assess market sentiment and potential trading opportunities across various timeframes and market environments.
Keep exploring
What we’ve verified
Access, alerts and repainting behaviour have not been independently verified for this indicator. Check the creator’s current publication and settings.
General descriptions and classifications are recovered research. Verified details above identify the specific checks we have completed. Check the creator’s current publication for later changes.