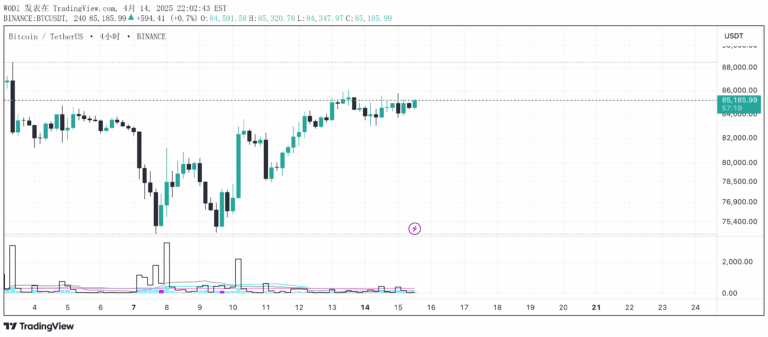
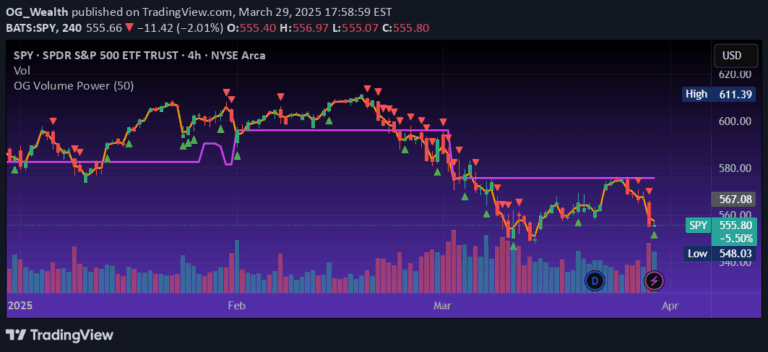
The Volume to Candle Size Ratio indicator analyzes trading volume relative to candle size, providing visual insights into potential trading opportunities through dynamic volume assessment.
Explore complementary indicator rolesHow it works
The Volume to Candle Size Ratio calculates the relationship between trading volume and the physical size of price candles. It creates a normalized metric by dividing total volume by the candle's height, which allows traders to understand volume intensity relative to price movement.
Users can set custom thresholds for percentage changes and absolute values, enabling personalized analysis. The indicator then generates a histogram with color-coded bars representing different volume-to-candle size scenarios, making it easy to visually interpret volume dynamics and potential market sentiment shifts.
Why it may be useful
This indicator provides traders with a nuanced understanding of volume dynamics beyond traditional volume analysis. By relating volume directly to candle size, it offers insights into the potential strength or weakness of price movements, helping traders assess market participation and momentum.
The color-coded visualization allows quick identification of significant volume changes, potentially signaling important market turning points or confirming trend strength. Traders can use these insights to make more informed decisions about entry, exit, and risk management strategies.
When to explore it
The Volume to Candle Size Ratio works best in liquid markets with consistent trading activity, such as major stock indices, forex pairs, and heavily traded commodities. It is particularly useful during periods of potential trend changes, breakouts, or when assessing the credibility of price movements.
Traders should combine this indicator with other technical analysis tools to validate signals and reduce false positives. It is most effective in shorter timeframes like intraday and scalping scenarios where volume fluctuations can provide immediate market insights.
Keep exploring
What we’ve verified
Access, alerts and repainting behaviour have not been independently verified for this indicator. Check the creator’s current publication and settings.
General descriptions and classifications are recovered research. Verified details above identify the specific checks we have completed. Check the creator’s current publication for later changes.