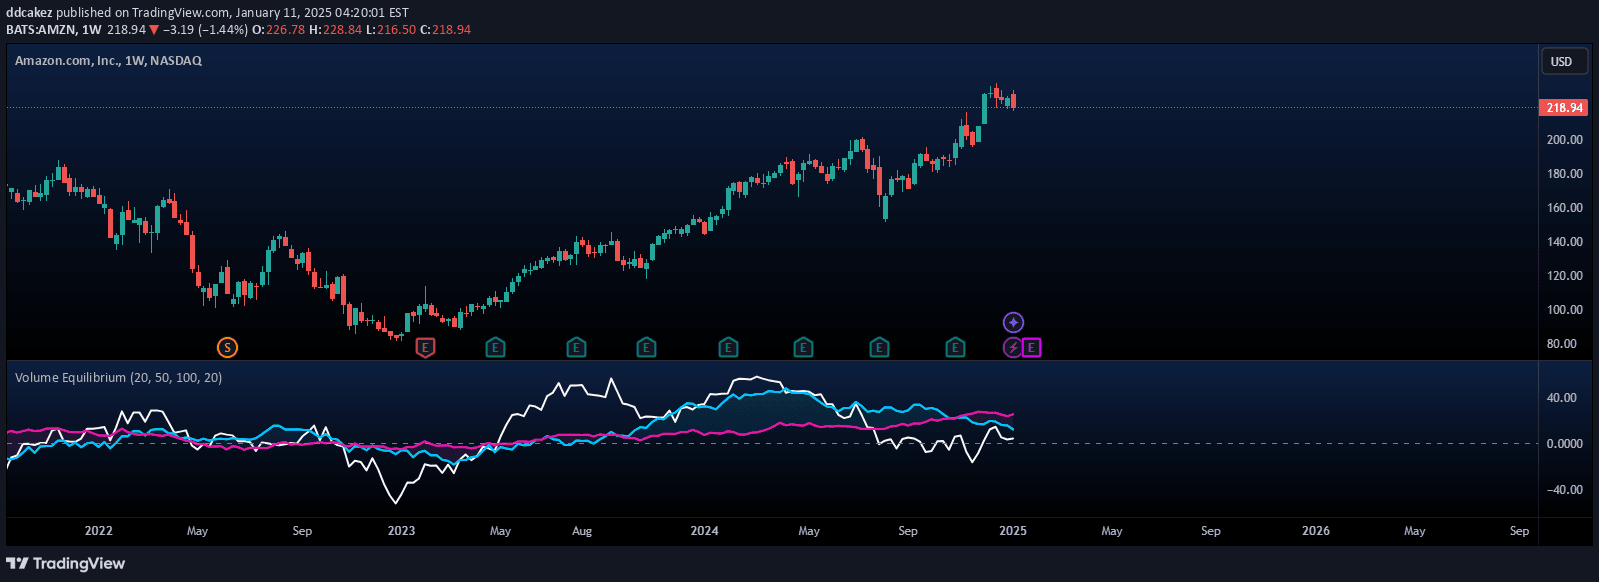
VTA is a volume-based trend analysis indicator that evaluates market strength by comparing bullish and bearish trading volumes to determine market direction and potential trading opportunities.
Explore complementary indicator rolesHow it works
The VTA indicator analyzes trading volume across bullish and bearish market states by tracking the relative strength of buying and selling pressures. It evaluates the gradual changes in volume for both bullish and bearish scenarios, creating a dynamic assessment of market momentum.
When bullish volume increases while bearish volume decreases, the indicator suggests a potential upward trend. Conversely, when bearish volume rises and bullish volume declines, it signals a potential downward trend. The indicator provides traders with a nuanced view of market sentiment by monitoring these volume fluctuations.
Why it may be useful
The VTA indicator is crucial for traders seeking to understand market dynamics beyond price movements by providing insights into the underlying strength of trends through volume analysis. It offers a more comprehensive view of market sentiment, helping traders make more informed decisions about potential market direction.
By tracking the balance between bullish and bearish volumes, traders can gain early signals about potential trend reversals or continuations. This approach allows for more strategic entry and exit points, reducing the risk of trading against the dominant market momentum.
When to explore it
The VTA indicator is most effective in markets with clear volume trends and during periods of significant market activity where volume changes can provide meaningful insights. It works particularly well in liquid markets with substantial trading volumes, such as major stock indices, forex pairs, and actively traded commodities.
Traders should use the VTA indicator in conjunction with other technical analysis tools to confirm signals and validate potential trading opportunities. It is especially useful during trending markets and can help identify potential trend strength and potential reversals before they become apparent through price action alone.
Keep exploring
What we’ve verified
Access, alerts and repainting behaviour have not been independently verified for this indicator. Check the creator’s current publication and settings.
General descriptions and classifications are recovered research. Verified details above identify the specific checks we have completed. Check the creator’s current publication for later changes.