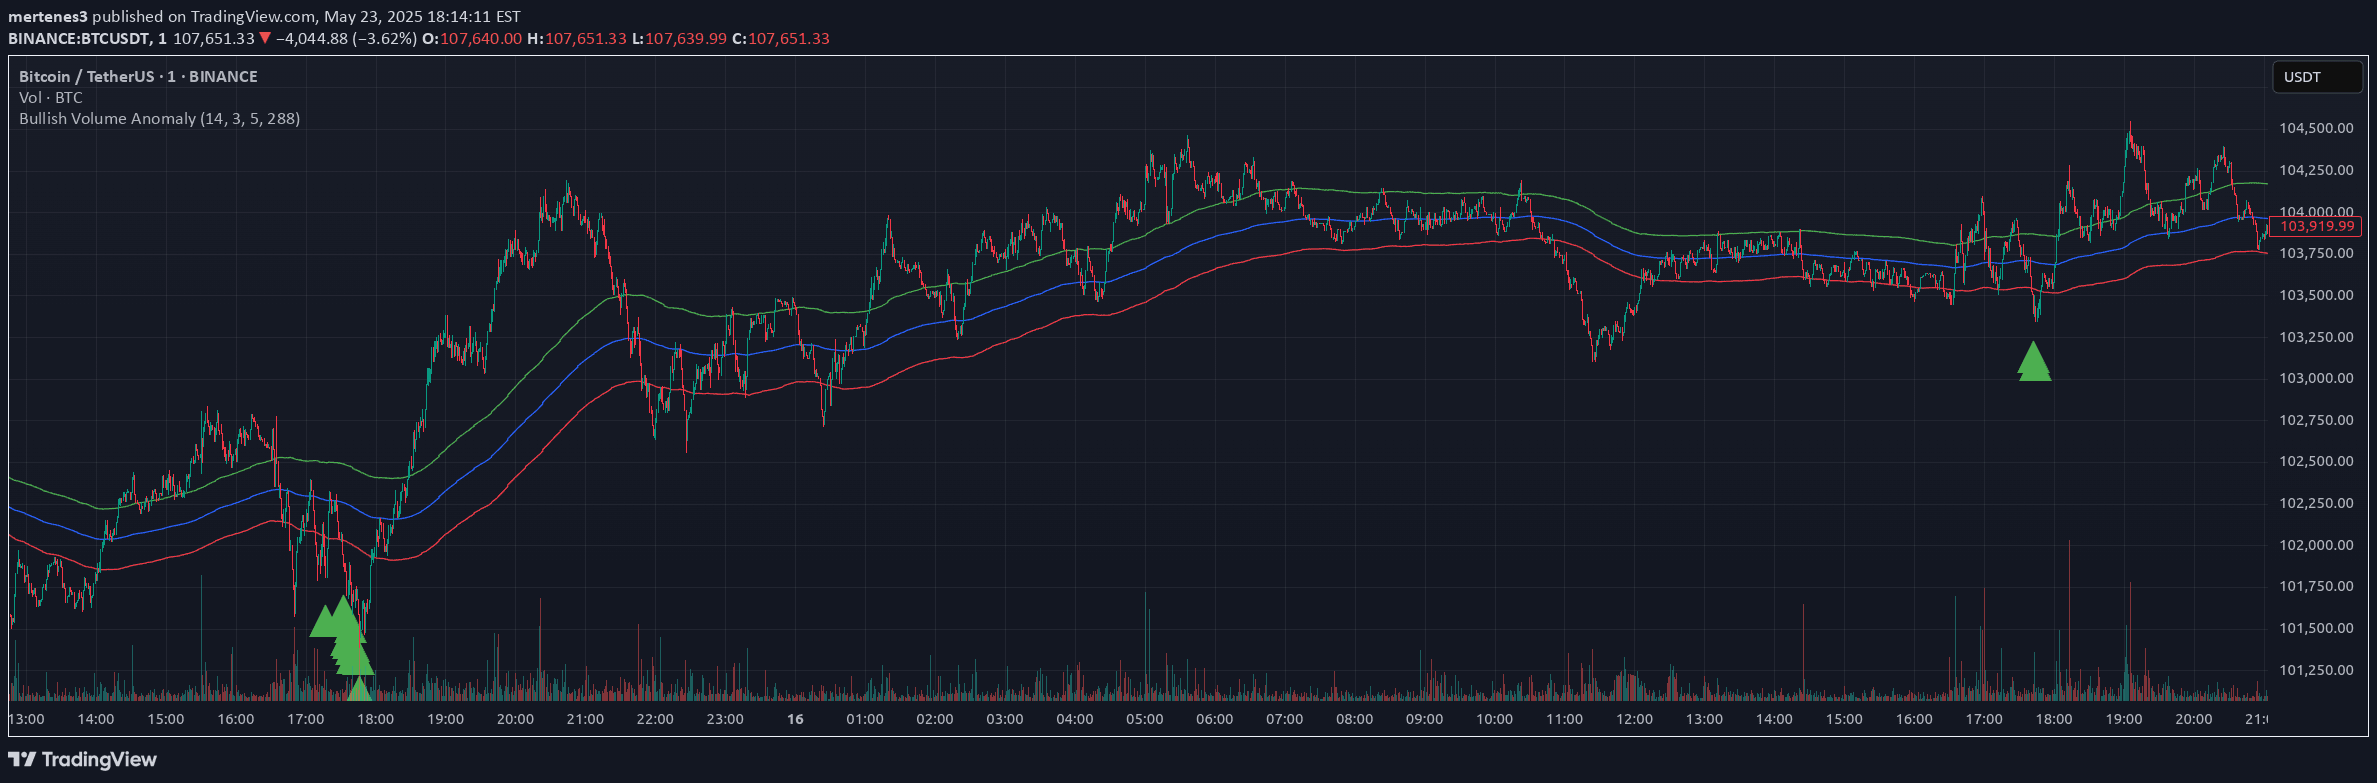
A volume indicator using Z-Score methodology to help traders understand market trend strength and potential continuation by analyzing trading volume across different timeframes.
Explore complementary indicator rolesHow it works
The Z-Score volume indicator calculates the statistical significance of trading volume by measuring how far a volume data point is from the mean volume. It transforms raw volume data into a normalized scale that helps traders quickly identify when volume is significantly higher or lower than typical market conditions.
By using statistical standard deviation, the indicator provides a standardized way to compare volume across different trading instruments and timeframes. When the Z-Score reaches extreme values, it signals potential significant market movements or trend confirmations.
Why it may be useful
Volume is a critical but often overlooked aspect of market analysis that provides insights into the strength and potential sustainability of price movements. By quantifying volume deviations, traders can better understand market dynamics and make more informed trading decisions.
The Z-Score approach allows traders to cut through noise and focus on statistically meaningful volume changes. This helps in identifying potential trend starts, confirmations, and possible reversals with greater precision than traditional volume indicators.
When to explore it
The Z-Score volume indicator works best during periods of significant market activity where trading volume can provide meaningful insights into potential price movements. It is particularly useful during breakouts, trend initiations, and when examining potential trend continuation or reversal scenarios.
Traders should pay special attention to extreme Z-Score values that indicate unusual volume activity. These moments can signal important market turning points or the beginning of strong trend movements across various trading timeframes.
Keep exploring
What we’ve verified
Access, alerts and repainting behaviour have not been independently verified for this indicator. Check the creator’s current publication and settings.
General descriptions and classifications are recovered research. Verified details above identify the specific checks we have completed. Check the creator’s current publication for later changes.