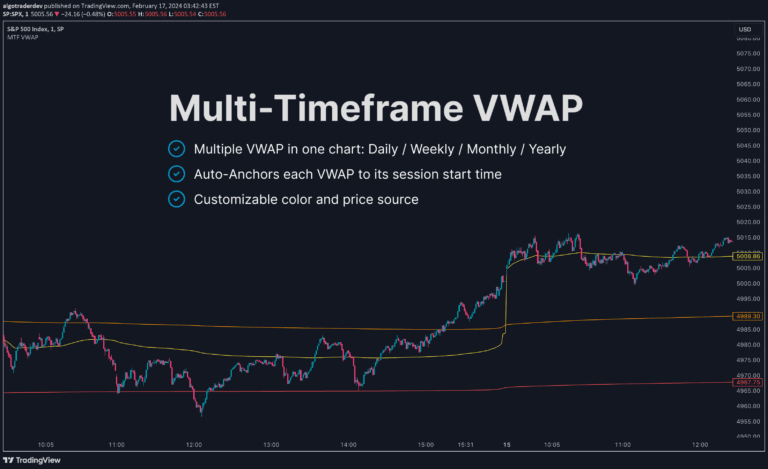
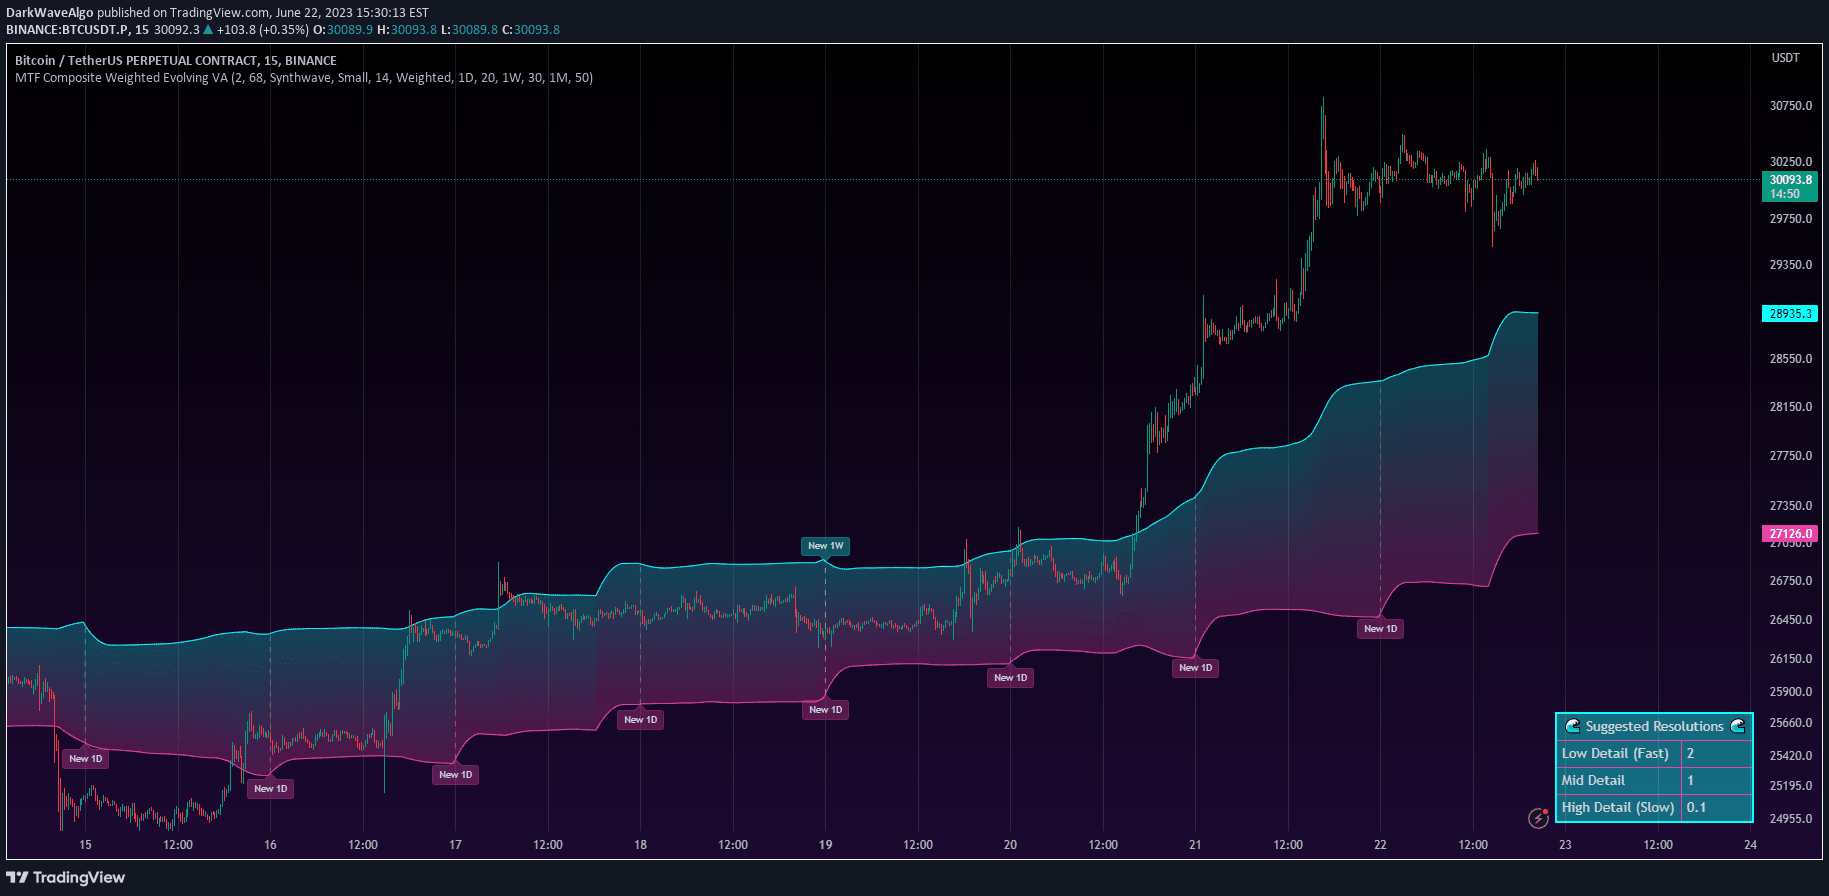
A multi-timeframe VWAP indicator that calculates volume-weighted average price across 15-minute, 1-hour, 4-hour, and daily intervals to help traders analyze market trends.
Explore complementary indicator rolesHow it works
The VWAP Multi-Timeframe Script calculates the Volume Weighted Average Price by multiplying the price of each trading period by its corresponding volume and then dividing by the total volume. It tracks VWAP across four distinct timeframes: 15 minutes, 1 hour, 4 hours, and daily, providing a comprehensive view of price movement.
The script color-codes the VWAP lines to indicate trend direction, with blue representing a higher VWAP compared to the previous period and red signaling a potential downward trend. By default, the calculation uses a length of 30 bars, allowing traders to customize the indicator's sensitivity and precision.
Why it may be useful
VWAP is crucial for intraday traders as it provides a volume-weighted perspective on average price, helping traders understand the true market value beyond simple price movements. By incorporating trading volume into the average price calculation, VWAP offers a more nuanced view of market dynamics and potential trend strength.
The multi-timeframe approach allows traders to simultaneously analyze price trends across different time horizons, reducing the need to switch between multiple charts. This comprehensive view can help traders make more informed decisions by providing a holistic understanding of price momentum and market sentiment.
When to explore it
The VWAP Multi-Timeframe Script is most effective for intraday traders seeking a comprehensive view of price trends across multiple timeframes. It works best in liquid markets with consistent trading volume, where the volume-weighted average can provide meaningful insights into market behavior.
Traders should use this indicator in combination with other technical analysis tools like moving averages or momentum indicators to confirm trading signals. It is particularly useful during active trading hours when volume is high and price movements are more significant, helping traders identify potential entry and exit points.
Keep exploring
What we’ve verified
Access, alerts and repainting behaviour have not been independently verified for this indicator. Check the creator’s current publication and settings.
General descriptions and classifications are recovered research. Verified details above identify the specific checks we have completed. Check the creator’s current publication for later changes.