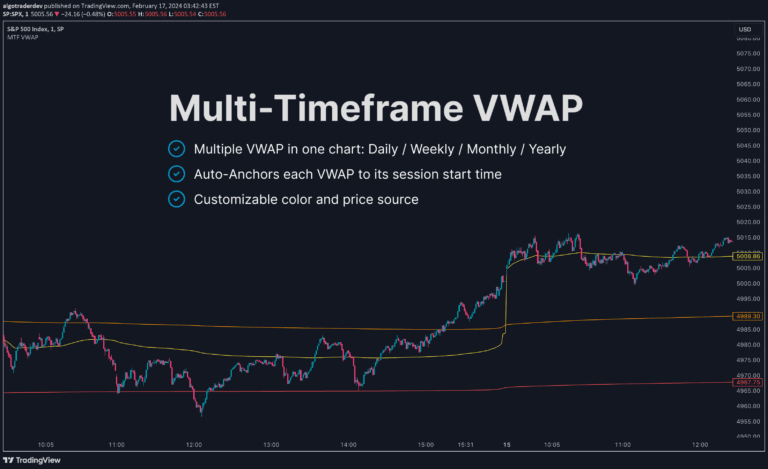
A multi-timeframe Volume Weighted Average Price (VWAP) indicator that helps traders analyze market trends, identify support and resistance levels across various timeframes.
Explore complementary indicator rolesHow it works
The VWAP indicator calculates a volume-weighted average price across different timeframes by integrating price and volume data. It uses standard deviation or percentage-based calculations to create multiple price levels, including current and previous period value area low and high points.
The indicator leverages hlc3 (average of high, low, close prices) as its default data source and offers customizable settings like open price tracking, merge functions, and adjustable multipliers. Traders can view levels across daily, weekly, monthly, and other timeframes to gain comprehensive market insights.
Why it may be useful
The VWAP indicator provides traders with a sophisticated tool for understanding market dynamics by integrating volume and price information across multiple timeframes. It offers a nuanced view of market trends, helping traders identify potential support and resistance levels more accurately than traditional price-only analysis.
By combining volume-weighted calculations with flexible visualization options, the indicator enables traders to make more informed decisions. Its ability to show current and previous period levels helps traders understand market context and potential price movement directions.
When to explore it
The VWAP indicator is most effective when analyzing markets with sufficient trading volume and when used in conjunction with other technical analysis tools. It works particularly well on 1-hour and 4-hour timeframes, where data constraints allow for comprehensive analysis.
Traders should utilize this indicator during trending markets, when seeking to confirm trend continuations or potential reversals. It is especially useful for identifying key support and resistance levels, optimizing entry and exit points, and gaining a deeper understanding of market dynamics across different timeframes.
Keep exploring
What we’ve verified
Access, alerts and repainting behaviour have not been independently verified for this indicator. Check the creator’s current publication and settings.
General descriptions and classifications are recovered research. Verified details above identify the specific checks we have completed. Check the creator’s current publication for later changes.