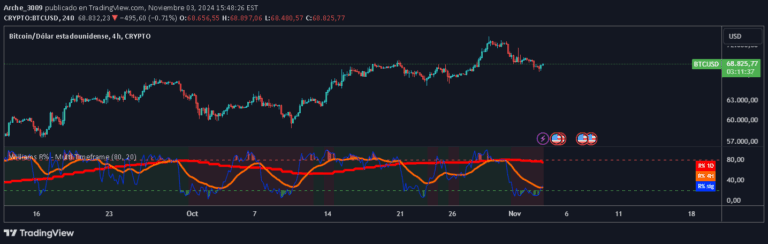
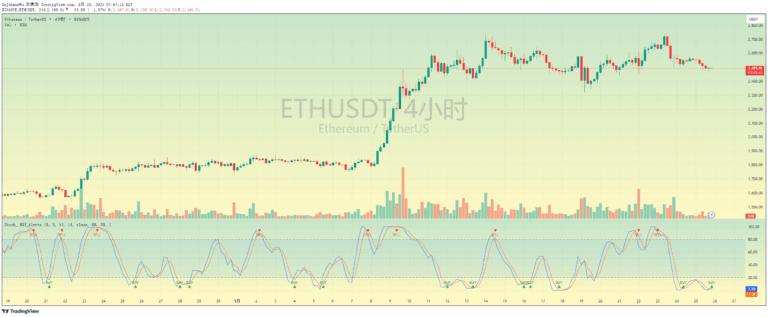
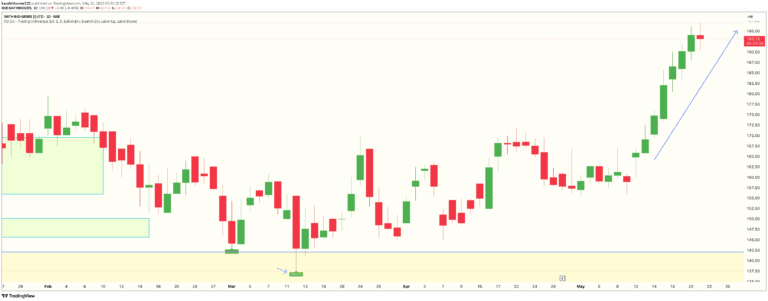
Williams %R Intensity combines classic Williams %R with dynamic intensity visualization to help traders identify overbought/oversold conditions and predict potential trend reversals with enhanced clarity.
Explore complementary indicator rolesHow it works
The Williams %R Intensity indicator calculates the current price's position relative to the highest high and lowest low over a specified period, typically using a 14-period length. It applies an exponential moving average (EMA) to smooth the %R values, creating a more refined trend tracking mechanism.
The indicator then visualizes the intensity based on the absolute distance between Williams %R and its EMA, with visual cues highlighting overbought (at -20) and oversold (at -80) zones. The intensity increases as the value approaches extreme levels, providing traders with a nuanced view of potential market momentum and trend changes.
Why it may be useful
The Williams %R Intensity offers traders a sophisticated approach to momentum analysis by combining multiple analytical techniques into a single, powerful indicator. It provides clear visual signals that help traders quickly identify potential market turning points and assess the strength of current trends.
By incorporating intensity visualization and crossover signals, the indicator reduces market noise and helps traders make more informed decisions. The ability to predict future crosses and highlight critical market conditions gives traders a proactive tool for identifying potential entry and exit points across different trading styles.
When to explore it
The Williams %R Intensity is most effective in markets with clear trending or ranging characteristics, where momentum shifts can be clearly identified. It works particularly well in volatile markets where quick identification of overbought and oversold conditions can provide valuable trading insights.
Traders should utilize this indicator across multiple timeframes, from short-term scalping to longer-term swing trading strategies. It is especially useful when combined with other technical analysis tools to confirm signals and develop more robust trading strategies.
Keep exploring
What we’ve verified
Access, alerts and repainting behaviour have not been independently verified for this indicator. Check the creator’s current publication and settings.
General descriptions and classifications are recovered research. Verified details above identify the specific checks we have completed. Check the creator’s current publication for later changes.