
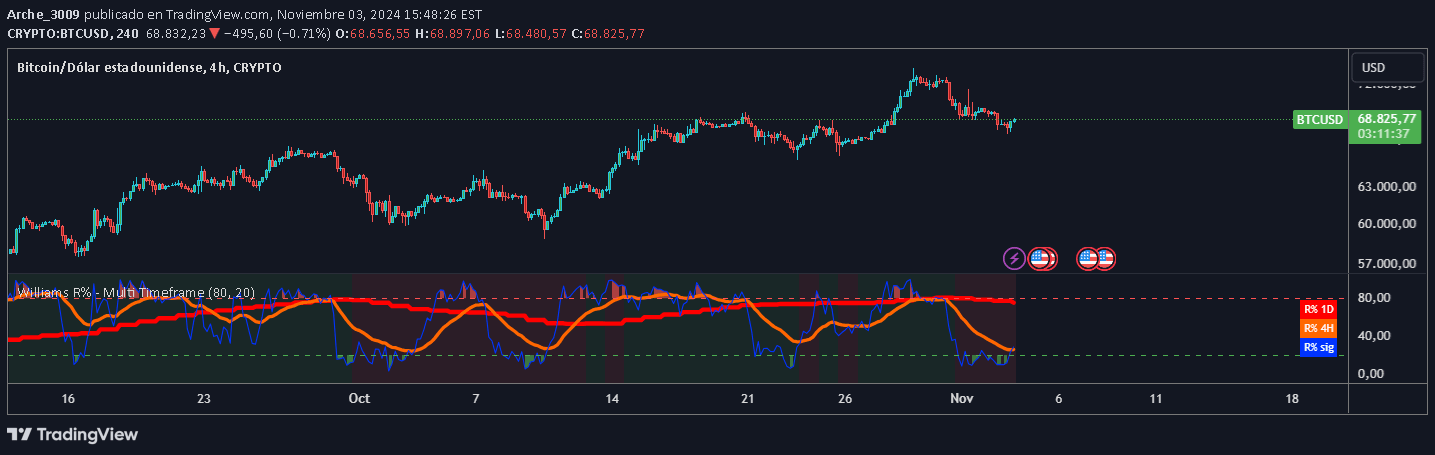
William %R is a multi-timeframe momentum indicator that helps traders identify potential price reversals by analyzing overbought and oversold conditions across different timeframes.
Explore complementary indicator rolesHow it works
The William %R indicator measures momentum by calculating the position of the closing price relative to the highest high and lowest low over a specific period. It generates values between 0 and -100, with readings above -20 considered overbought and readings below -80 considered oversold.
When applied across multiple timeframes (1H, 4H, 1D), the indicator creates a comprehensive view of market momentum. Traders can observe the alignment of %R curves to identify potential trend reversals and confirm trading signals.
Why it may be useful
The William %R provides traders with a nuanced understanding of market momentum and potential trend reversals across different timeframes. By analyzing price positioning relative to recent highs and lows, traders can gain insights into market sentiment and potential price direction.
Its multi-timeframe approach allows traders to validate signals and improve trade timing by confirming momentum across different chart periods, reducing the likelihood of false signals and enhancing overall trading strategy.
When to explore it
The William %R is most effective when used on 1-hour and 4-hour charts, where traders can compare curves across multiple timeframes. It works best in trending markets where momentum shifts are more predictable and clear.
Traders should look for confluence between different timeframe curves and use the indicator in conjunction with other technical analysis tools to confirm potential entry and exit points. Signals above 80 or below 20 are particularly significant for identifying potential trend reversals.
Keep exploring
What we’ve verified
Access, alerts and repainting behaviour have not been independently verified for this indicator. Check the creator’s current publication and settings.
General descriptions and classifications are recovered research. Verified details above identify the specific checks we have completed. Check the creator’s current publication for later changes.


