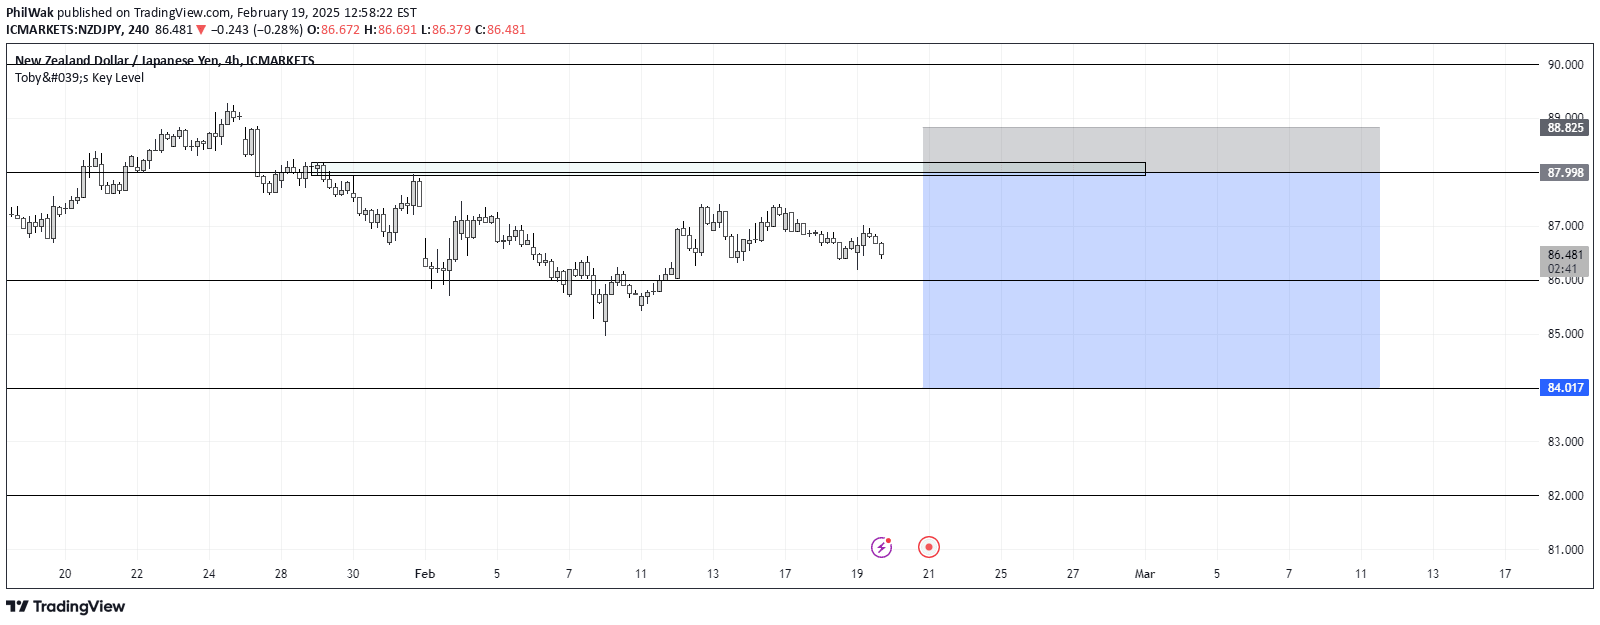
An indicator for XAU/USD traders that identifies key market levels based on different timeframe candles, helping traders understand potential market maker protection zones.
Explore complementary indicator rolesHow it works
The XAU/USD Key Levels indicator analyzes multiple timeframe candles to identify significant price levels that market makers are likely to protect. It examines key periods including H4 (1 trading session), D1 (1 trading day), W1 (1 trading week), MN1 (1 trading month), D2 (last 2 trading days), and D3 (last 3 trading days).
By mapping these critical price zones, the indicator helps traders understand potential support and resistance levels where price movements might stall or reverse. The methodology assumes that market makers have strategic interests in maintaining certain price levels, making these zones particularly important for trading decisions.
Why it may be useful
Understanding key market levels provides traders with critical insights into potential price barriers and market maker strategies. These levels can help traders anticipate potential trend reversals, support and resistance zones, and manage risk more effectively by identifying areas where price might encounter significant market activity.
By highlighting these strategic price zones, traders can make more informed decisions about entry and exit points, stop-loss placement, and overall trading strategy. The indicator's multi-timeframe approach offers a comprehensive view of potential market dynamics across different trading periods.
When to explore it
The XAU/USD Key Levels indicator is most effective when trading gold markets with a focus on identifying potential market maker intervention zones. Traders should use this signal when looking for high-probability entry and exit points, especially during periods of market uncertainty or potential trend changes.
It is particularly useful for traders who want to understand the underlying market structure and potential price manipulation strategies. The indicator can be applied across various trading styles, from scalping to swing trading, providing valuable insights into potential price movement constraints.
Keep exploring
What we’ve verified
Access, alerts and repainting behaviour have not been independently verified for this indicator. Check the creator’s current publication and settings.
General descriptions and classifications are recovered research. Verified details above identify the specific checks we have completed. Check the creator’s current publication for later changes.