Single Prints - Bright
Single Prints indicator identifies unique price levels with minimal trading activity, helping traders spot potential support and resistance zones through color-coded visual representation.
Explore 11,183 indicators. Filter beyond the obvious.
Discover the tools that fit the way you trade.
11,183 tools to explore
Single Prints indicator identifies unique price levels with minimal trading activity, helping traders spot potential support and resistance zones through color-coded visual representation.
A comprehensive trading strategy combining Supertrend and 200 EMA to identify trend reversals and potential entry/exit points across different market conditions.
A technical analysis tool that highlights daily trading patterns by visually marking specific days of the week, helping traders identify potential market behavior trends across different timeframes.
A custom TradingView tool that identifies times when the digital root of the current time is 9, highlighting numerologically significant moments for traders.
An indicator that identifies and visualizes untested price levels across multiple timeframes, helping traders spot potential support and resistance zones with high trading significance.
A volume-based oscillator that normalizes trading volume between 0-100, helping traders assess current market activity relative to recent historical performance.
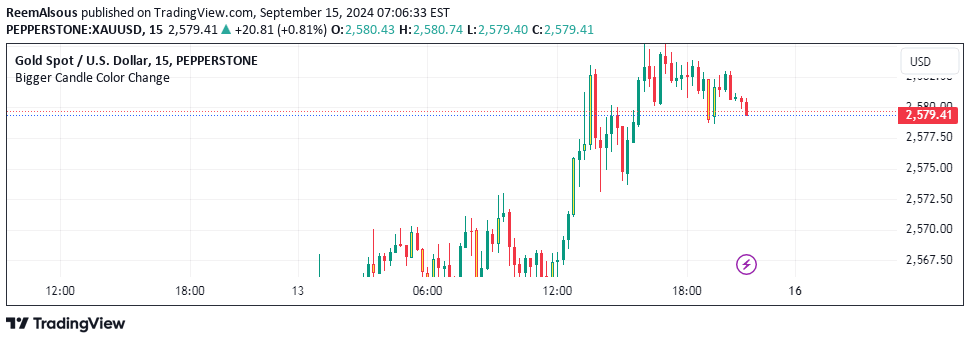
An indicator that identifies large price candles exceeding the size of the previous six candles, highlighting potential breakout or reversal moments in market price action.
A market risk measurement tool analyzing bond market conditions and U.S. dollar strength to evaluate potential economic and market instability across different asset classes.
Likes, views, and comments are historical TradingView snapshots. They describe attention, not trading performance.