Trading ABC
An advanced pattern recognition indicator that identifies ABC chart patterns using trend cloud, ZigZag, and Fibonacci levels to detect potential trading opportunities with customizable settings.
Explore 11,183 indicators. Filter beyond the obvious.
Discover the tools that fit the way you trade.
11,183 tools to explore
An advanced pattern recognition indicator that identifies ABC chart patterns using trend cloud, ZigZag, and Fibonacci levels to detect potential trading opportunities with customizable settings.
A comprehensive trading indicator combining Parabolic SAR, EMA 200, and MACD to generate precise buy and sell signals by analyzing market trends and momentum.
A trading tool that identifies entry points by retesting the average price between two swing points, using volatility and user-defined parameters to generate precise trade signals.
A dynamic RSI-based tool that identifies market squeeze and breakout zones by analyzing price momentum and detecting short-term support and resistance levels.
A technical analysis indicator using Fibonacci levels and key moving averages to identify market tops, bottoms, and trend directions for precise entry and exit points in trading.
A trading indicator combining Supertrend and 200 EMA to identify market trends and potential buy/sell opportunities by analyzing price movements and moving averages.
A scalping indicator using RSI crossovers and moving averages to generate trading signals. Combines multiple technical analysis tools to identify potential trend reversals and momentum shifts.
A dynamic volume analysis tool that separates bullish and bearish volumes to reveal market sentiment and volume dynamics across different price levels.
A Bitcoin valuation tool that assesses market value by comparing current price to moving averages and logarithmic trendlines, providing insights into potential trading opportunities.
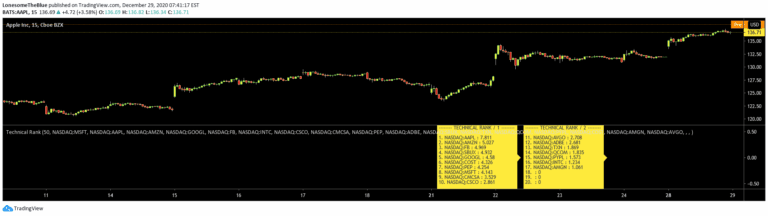
Technical Rank evaluates a security's performance by analyzing multiple indicators across long, medium, and short-term timeframes, providing a comprehensive ranking of technical strength.
A trading strategy identifying potential long entry opportunities by analyzing volume, price movements, and technical indicators to spot high-probability stock trades.
Market Smith's advanced charting tool providing comprehensive stock analysis through moving averages, pivot points, relative strength line, and rating to evaluate stock performance.
Likes, views, and comments are historical TradingView snapshots. They describe attention, not trading performance.