Trading ABC
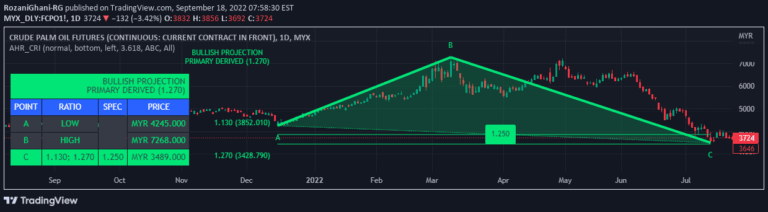
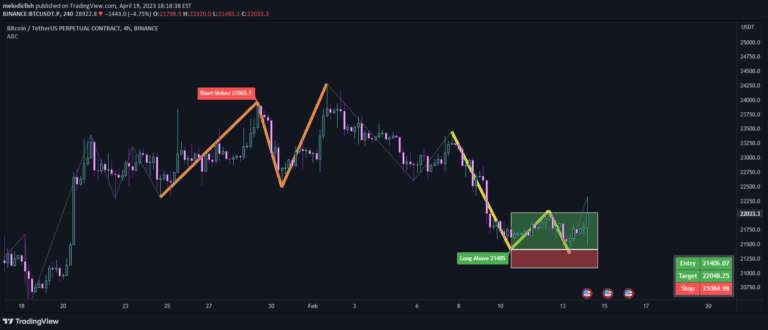
An advanced pattern recognition indicator that identifies ABC chart patterns using trend cloud, ZigZag, and Fibonacci levels to detect potential trading opportunities with customizable settings.
Explore 11,183 indicators. Filter beyond the obvious.
Discover the tools that fit the way you trade.
11,183 tools to explore
An advanced pattern recognition indicator that identifies ABC chart patterns using trend cloud, ZigZag, and Fibonacci levels to detect potential trading opportunities with customizable settings.
ABC Pattern is a three-wave corrective trading indicator that identifies potential trend reversals and price movements by analyzing impulse and corrective waves in market trends.
A specialized trading tool for identifying and executing harmonic patterns using the XABCD methodology, simplifying complex pattern recognition and trade management for both novice and experienced traders.
ABCD Projection Indicator identifies and projects ABCD chart patterns using a Zigzag-based approach, helping traders spot potential trend continuation opportunities in financial markets.
A harmonic trading indicator based on Scott Carney's method that uses Fibonacci ratios to identify potential price reversal zones and trading patterns through precise point-based analysis.
Advanced harmonic pattern detection tool with customizable pattern recognition, dynamic band filters, and comprehensive backtesting capabilities for traders seeking flexible technical analysis strategies.
An ABC Pattern finding tool that helps traders identify specific price formations with customizable bar settings and automatic trade box generation for precise entry and exit levels.
Volume Forks is an advanced trading indicator that combines recursive auto-pitchfork and angled volume profile to analyze price dynamics and trend formations automatically.
ABCD harmonic pattern identifies potential price reversal zones using precise Fibonacci ratios across four points A, B, C, and D in both bullish and bearish market conditions.
A sophisticated harmonic pattern using Fibonacci ratios to identify potential market reversals, characterized by precise geometric configurations at trend endings.
The Gartley pattern is a harmonic trading pattern that identifies potential market reversals using specific Fibonacci retracement levels across five points: X, A, B, C, and D.
The Crab pattern is a harmonic trading pattern that identifies potential price reversals using Fibonacci ratios, helping traders predict trend changes in both bullish and bearish market conditions.
Likes, views, and comments are historical TradingView snapshots. They describe attention, not trading performance.