Probability Cones
A probability cone is a statistical forecast indicator that visualizes potential price distribution using standard or Laplace distributions, helping traders understand potential price movement ranges.
Explore 11,183 indicators. Filter beyond the obvious.
Discover the tools that fit the way you trade.
11,183 tools to explore
A probability cone is a statistical forecast indicator that visualizes potential price distribution using standard or Laplace distributions, helping traders understand potential price movement ranges.
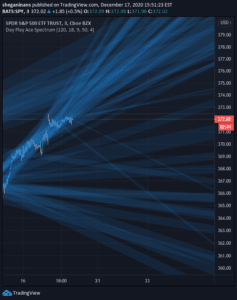
Daily Play Ace Spectrum is an advanced, configurable trading indicator extending the original Ace Spectrum with more parameters for enhanced sensitivity and adaptability across shorter timeframes.
ConeCast is a forward-looking projection indicator that visualizes potential future price ranges by combining trend momentum and adaptive volatility into a predictive cone.
A statistical probability cone that forecasts potential future price ranges using log returns, volatility, and inverse normal distribution across multiple confidence levels.
A technical analysis tool that projects potential future price ranges by calculating rolling standard deviation from log returns, helping traders visualize expected price dispersion.
Likes, views, and comments are historical TradingView snapshots. They describe attention, not trading performance.