Divergence for Many Indicators v4
Advanced trading tool that detects divergences across multiple technical indicators, helping traders identify potential trend reversals and momentum shifts through comprehensive pivot point analysis.
Explore 11,183 indicators. Filter beyond the obvious.
Discover the tools that fit the way you trade.
11,183 tools to explore
Advanced trading tool that detects divergences across multiple technical indicators, helping traders identify potential trend reversals and momentum shifts through comprehensive pivot point analysis.
Pivot Point SuperTrend is an advanced trend-following indicator that combines pivot points with SuperTrend to generate more reliable trading signals and identify potential trend reversals.
A multi-indicator divergence script that analyzes divergences across 10 different technical indicators to identify potential trend reversals and price movements.
A custom indicator using linear regression to analyze closing prices, helping traders identify market trends, mean reversion, and potential overbought or oversold conditions across different timeframes.
HARSI is a unique oscillator combining Heikin Ashi candles with RSI calculations, designed to reduce noise and provide smoother trend analysis for traders.
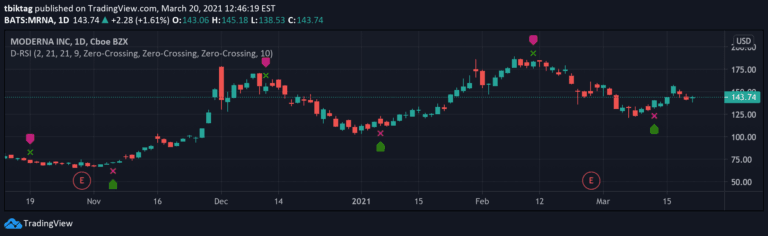
Delta-RSI Oscillator is a momentum indicator that measures the rate of change in RSI through a smoothed time derivative, providing dynamic insights into market momentum shifts.
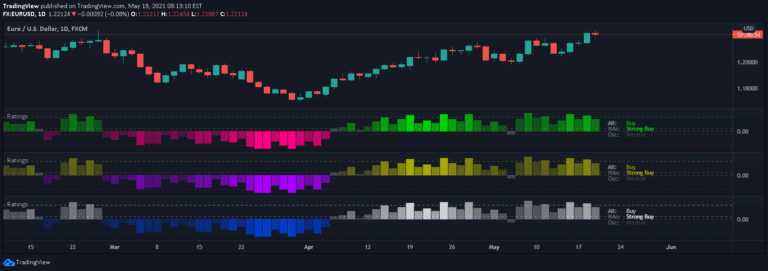
A comprehensive trading signal that aggregates 26 technical indicators into a single rating, evaluating market sentiment through moving averages and oscillators to provide actionable trading insights.
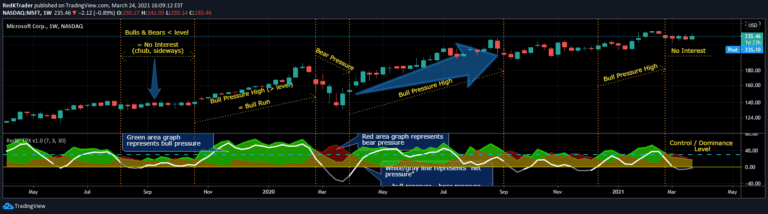
The RedK Trader Pressure Index (TPX) analyzes price bar changes to reveal the ongoing battle between bulls and bears, providing insights into market control and potential price action direction.
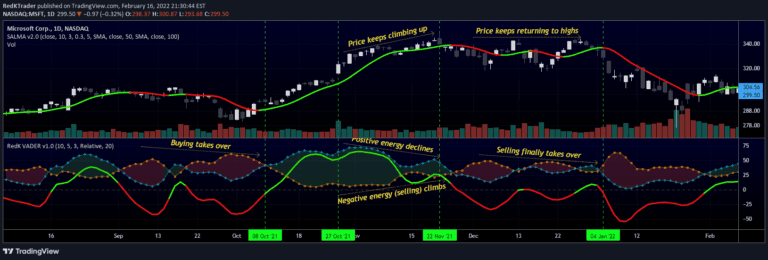
VADER is a volume-based technical indicator that measures market energy by analyzing price displacement and trading volume to determine bullish or bearish market sentiment.
A comprehensive multi-indicator script that displays various technical indicators in separate windows, allowing traders to customize and analyze market momentum, volume, and trend signals.
A dynamic trading panel displaying multiple technical indicators in a color-coded table format, allowing traders to quickly assess market conditions across multiple symbols simultaneously.
Momentum Bars (Mo_Bars) is a three-moving average based indicator that visualizes relative momentum changes, helping traders identify potential trend shifts and momentum direction.
Likes, views, and comments are historical TradingView snapshots. They describe attention, not trading performance.