Volume and vPOC Insights
A volume-based indicator that identifies the most significant trading levels by revealing where the highest trading volume occurred during a specific lookback period.
Explore 11,183 indicators. Filter beyond the obvious.
Discover the tools that fit the way you trade.
11,183 tools to explore
A volume-based indicator that identifies the most significant trading levels by revealing where the highest trading volume occurred during a specific lookback period.
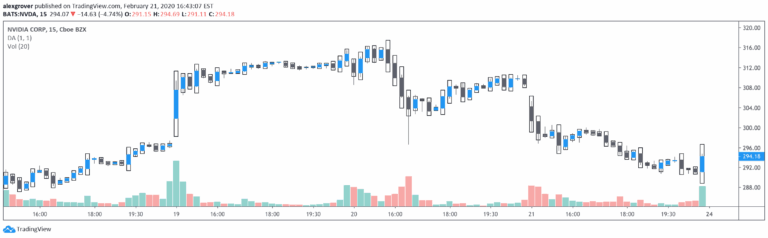
Dekidaka-Ashi is a unique candlestick visualization tool that integrates volume data with price action, creating enhanced candlesticks that reveal trading activity and potential market movements.
A trading indicator that identifies price imbalances like fair value gaps and large candle wicks across different timeframes, helping traders spot potential liquidity and rebalancing opportunities.
A custom RSI indicator that visualizes overbought and oversold levels using color-coded bands, allowing traders to identify potential trend reversals more intuitively.
A volume weighted average price (VWAP) indicator that allows traders to anchor and customize price analysis across multiple timeframes and periods with configurable settings.
An advanced technical analysis tool that automatically identifies supply and demand zones using market structure and Fibonacci retracements to highlight potential reversal and support/resistance areas.
The Zahorchak Measure is a market bias indicator that analyzes multiple moving averages of NYSE Composite to determine bullish or bearish market trends with smoothed oscillation.
The Exponential Action Map (EAM) is an advanced volume profile indicator that uses exponential weighting to analyze trading activity, revealing nuanced volume dynamics beyond traditional methods.
A technical indicator that identifies swing points, trends, and support/resistance levels by marking key pivot points and calculating a dynamic center line on price charts.
A manual profit and loss tracking tool that allows traders to input total cost and quantity, displaying real-time portfolio performance metrics on the trading chart.
A trading indicator combining RSI momentum with EMA trend filtering to generate high-probability buy and sell signals, using colored candles to highlight market conditions.
A trading indicator that highlights previous daily and weekly price levels, providing traders with key reference points for potential support, resistance, and equilibrium zones.
Likes, views, and comments are historical TradingView snapshots. They describe attention, not trading performance.