Asset Rotation System [InvestorUnknown]
A dynamic asset rotation system analyzing six assets using multiple trend indicators to identify and hold the most optimal performing asset against USD and across asset pairs.
Explore 11,183 indicators. Filter beyond the obvious.
Discover the tools that fit the way you trade.
11,183 tools to explore
A dynamic asset rotation system analyzing six assets using multiple trend indicators to identify and hold the most optimal performing asset against USD and across asset pairs.
A comprehensive price conversion tool for SPY, SPX, ES, and SPX500USD traders to synchronize and analyze price levels across multiple linked instruments.
An advanced candlestick pattern analysis tool that provides historical return percentages for different candle formations, helping traders understand market psychology and potential price movements.
An adaptive moving average indicator that dynamically classifies market trends by combining multiple moving average types and lengths to generate sophisticated trading signals.
A dynamic RSI variant using Lévy Flight modeling to enhance momentum detection by dynamically weighting price changes with improved responsiveness and trend sensitivity.
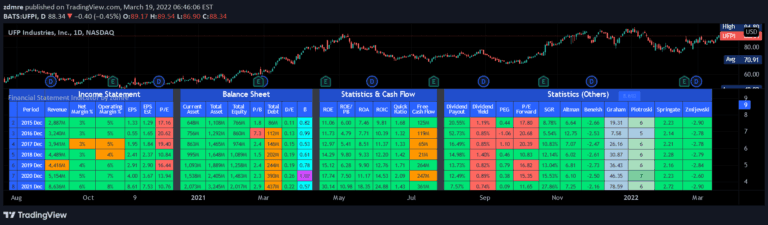
A comprehensive financial analysis tool that combines key financial statement metrics to assess a company's financial health, performance, and investment potential across income, balance sheet, and cash flow dimensions.
A comprehensive financial health assessment that evaluates a company's debt management, liquidity, and profitability through multiple key financial metrics and risk indicators.
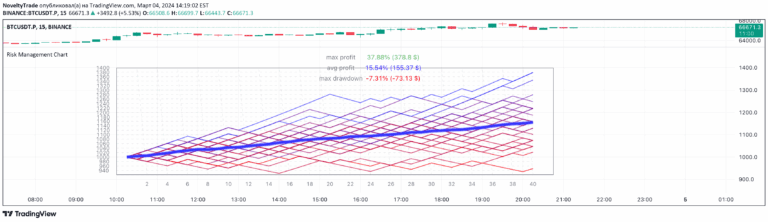
A trading tool that simulates random trades and visualizes risk management strategies by generating multiple trade scenarios with different win/loss probabilities and equity calculations.
An advanced Fibonacci retracement script offering dual lookback periods for comprehensive market analysis, providing dynamic and customizable support and resistance levels across different timeframes.
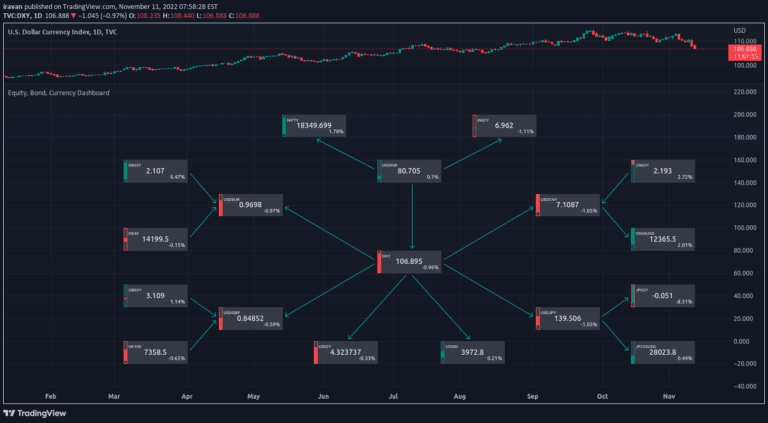
A comprehensive market flow visualization tool tracking demand dynamics across currencies, equities, and bonds of six countries, revealing interconnected market movements and smart money flows.
A trading indicator that captures 30-second opening ranges from different market sessions and generates dynamic price targets based on these initial market movements.
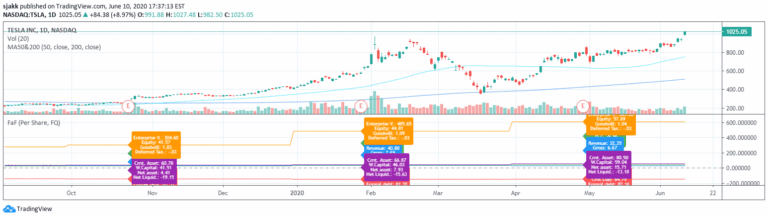
A comprehensive financial health indicator that analyzes quarterly reporting data, displaying trends in debt, cash, and earnings through a unique Pine Script approach for comprehensive market analysis.
Likes, views, and comments are historical TradingView snapshots. They describe attention, not trading performance.