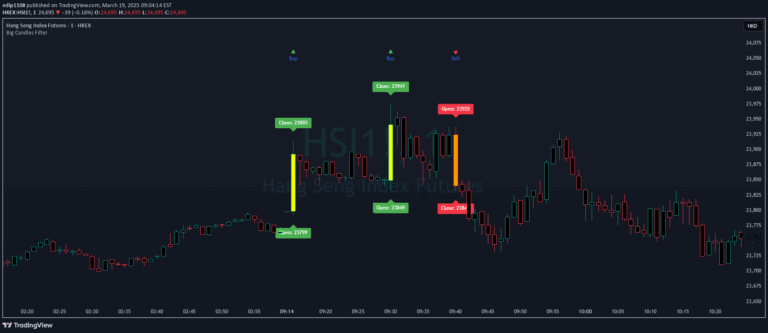
An advanced candlestick pattern analysis tool that provides historical return percentages for different candle formations, helping traders understand market psychology and potential price movements.
Explore complementary indicator rolesHow it works
The indicator generates a comprehensive table that tracks and analyzes various candlestick patterns across historical price data. It calculates return percentages for different candle formations by simulating trading strategies. Users can customize backtest settings including initial equity, leverage, entry mode, and risk-reward parameters.
The tool examines each candlestick pattern's performance by tracking potential entry points, stop-loss ranges, and potential profit scenarios. It provides a systematic approach to evaluating the effectiveness of different candlestick pattern strategies
Why it may be useful
Candlestick pattern analysis offers crucial insights into market psychology and potential price movements. This indicator helps traders move beyond subjective interpretations by providing data-driven evidence of pattern performance.
It allows traders to understand historical pattern reliability, potential returns, and risk management strategies. By presenting quantitative results, the tool helps traders make more informed decisions and potentially improve their trading strategies. It transforms candlestick patterns from subjective visual cues into measurable trading signals
When to explore it
The indicator is most effective when traders want to validate candlestick pattern strategies across different market conditions. It works best with liquid markets and timeframes that provide sufficient historical data for robust analysis.
Traders should use this tool during periods of market stability and when seeking to develop or refine trading strategies. It is particularly useful for systematic traders who prefer evidence-based approach to technical analysis. The tool can help identify which candlestick patterns are most reliable across different market scenarios
Keep exploring
What we’ve verified
Access, alerts and repainting behaviour have not been independently verified for this indicator. Check the creator’s current publication and settings.
General descriptions and classifications are recovered research. Verified details above identify the specific checks we have completed. Check the creator’s current publication for later changes.