Historical Price Projection [LuxAlgo]
A price projection tool that forecasts future market behavior by analyzing historical price patterns and applying a user-defined growth factor to simulate potential price movements.
Explore 11,183 indicators. Filter beyond the obvious.
Discover the tools that fit the way you trade.
11,183 tools to explore
A price projection tool that forecasts future market behavior by analyzing historical price patterns and applying a user-defined growth factor to simulate potential price movements.
A custom trading tool that generates monthly and yearly performance tables for trading strategies, helping traders analyze historical strategy performance and identify key periods of success or weakness.
A performance evaluation tool that calculates risk-adjusted return metrics like Sharpe, Sortino, and Omega Ratios to help traders assess investment performance and risk.
A trading tool that identifies top-performing stocks within specific industry groups by analyzing performance metrics like YTD return and relative strength.
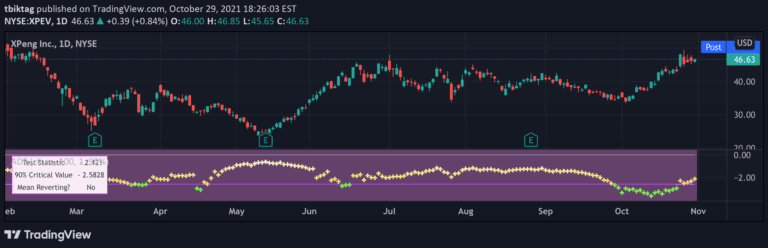
The Augmented Dickey-Fuller test statistically evaluates mean reversion in price series by analyzing the tendency of prices to return to an average level over time.
An advanced candlestick pattern analysis tool that provides historical return percentages for different candle formations, helping traders understand market psychology and potential price movements.
A script for quickly analyzing trading signals by computing performance metrics across different stop-loss and take-profit configurations using SuperTrend signals.
A Monte Carlo simulation tool that generates multiple potential future paths for trading strategies by resampling historical returns, helping traders understand potential performance variability and risk.
BjCandlePatterns is a comprehensive Japanese candlestick pattern recognition library that detects and labels various trading patterns to help traders identify potential market reversals and trend changes.
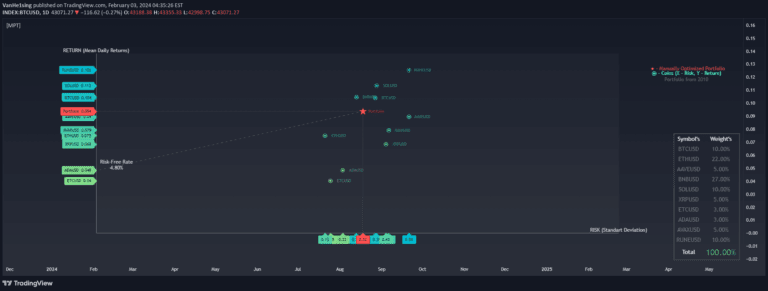
A Modern Portfolio Theory tool that helps traders optimize investment allocations by analyzing risk and return across multiple assets using a comprehensive scatter plot visualization.
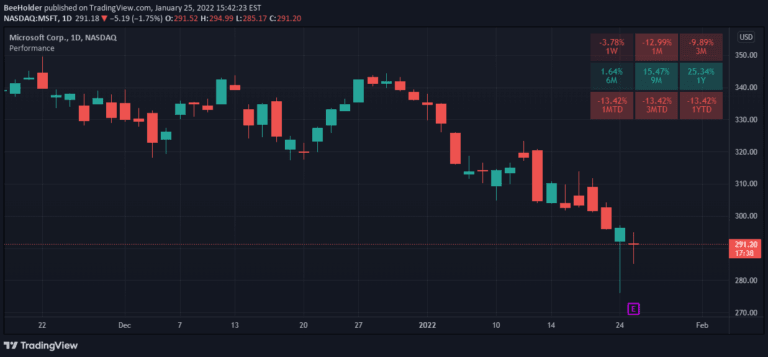
A performance indicator that compares current price to past prices, calculating returns over different time periods like 1 week, 1 month, and 1 year to track symbol performance.
A risk-adjusted returns indicator for Bitcoin that evaluates asset valuation through a Sharpe Ratio calculation over 180 days, providing color-coded insights into market conditions.
Likes, views, and comments are historical TradingView snapshots. They describe attention, not trading performance.