Smart Money Concepts Probability (Expo)
A trading indicator tracking institutional investor actions by calculating probabilities of market structure changes and order flow direction for strategic trading decisions.
Explore 11,183 indicators. Filter beyond the obvious.
Discover the tools that fit the way you trade.
11,183 tools to explore
A trading indicator tracking institutional investor actions by calculating probabilities of market structure changes and order flow direction for strategic trading decisions.
A charting tool that measures traded volume and money flow across price levels, revealing trading activity, sentiment, and key market levels for strategic analysis.
A footprint bar indicator that visualizes volume or open interest data within the chart's visible range, offering three different heatmap styles to analyze trading activity.
The RMI Trend Sniper is a sophisticated trend-following indicator that combines RSI and MFI to generate momentum signals and identify potential market trend reversals.
AlphaTrend is a dynamic trend-following indicator that uses Money Flow Index or RSI to generate buy and sell signals based on trend direction and momentum crossovers.
An advanced trading indicator implementing the ICT Turtle Soup strategy, which identifies liquidity zones and market structure shifts to generate precise entry and exit signals for traders.
A sophisticated charting tool that analyzes price and volume data to reveal market sentiment, liquidity distribution, and significant trading levels across different market conditions.
A charting tool that tracks money flow and trading pressure across different price ranges, revealing market sentiment and significant price levels through buying and selling activity visualization.
A comprehensive price action toolkit that analyzes market structure, liquidity, order blocks, and trend lines to help traders identify potential entry and exit points.
A liquidity indicator that identifies potential market order zones by mapping swing highs and lows, revealing where stop-loss orders and significant liquidity pools are likely positioned.
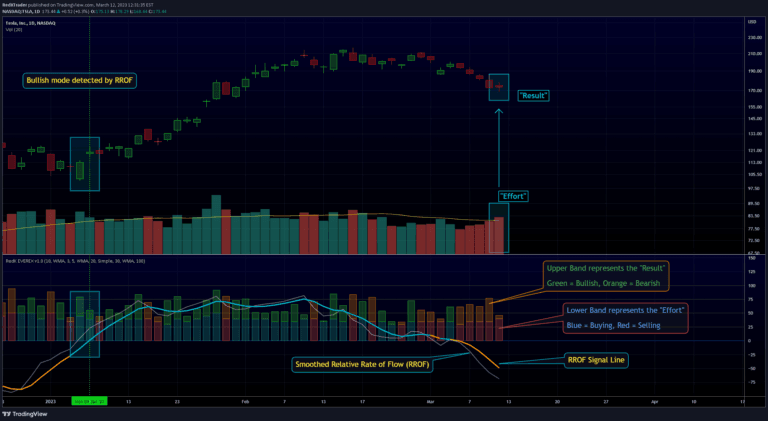
An experimental trading indicator that analyzes volume and price action using Volume Price Analysis and Wyckoff's Effort versus Result law to detect market strength and potential reversals.
A comprehensive multi-indicator script that displays various technical indicators in separate windows, allowing traders to customize and analyze market momentum, volume, and trend signals.
Likes, views, and comments are historical TradingView snapshots. They describe attention, not trading performance.