Zigzag Trend/Divergence Detector
A trading signal that combines trend bias, oscillator analysis, and divergence detection to help traders make more informed decisions about trend continuation, reversal, and potential profit-taking.
Explore 11,183 indicators. Filter beyond the obvious.
Discover the tools that fit the way you trade.
11,183 tools to explore
A trading signal that combines trend bias, oscillator analysis, and divergence detection to help traders make more informed decisions about trend continuation, reversal, and potential profit-taking.
An algorithmic tool that generates target levels based on market structure shifts and breaks, helping traders identify potential take profit, entry, and reversal points.
A dynamic asset rotation system analyzing six assets using multiple trend indicators to identify and hold the most optimal performing asset against USD and across asset pairs.
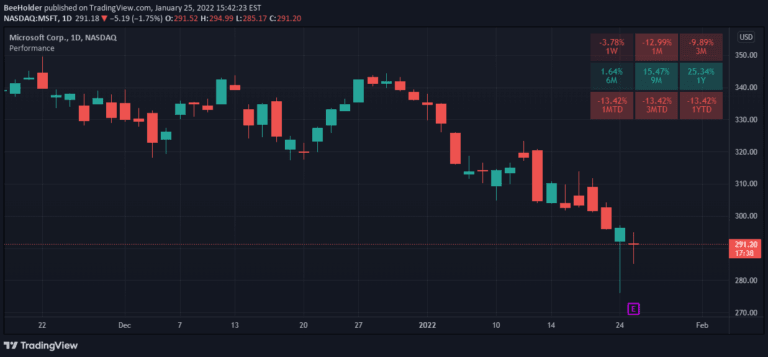
A performance indicator that compares current price to past prices, calculating returns over different time periods like 1 week, 1 month, and 1 year to track symbol performance.
Analyst Table provides comprehensive visual representation of analyst estimates and recommendations, displaying price targets and sentiment directly on the trading chart for quick market insights.
A trading strategy combining Relative Strength line with moving averages to identify stock performance versus the S&P 500 and detect moments of strength and weakness in price movements.
The RTI Threshold Indicator tracks market trend strength by comparing price to dynamic trend boundaries, helping traders identify long-term trend conditions and potential entry/exit points.
Short-Term Holder MVRV compares Bitcoin's market value to realized value for coins held under 155 days, revealing profitability and market sentiment of short-term investors.
A comprehensive precious metals trading tool analyzing the Gold-Silver Ratio (GSR) to provide insights into metal performance, relative valuation, and potential trading opportunities.
ICT Daily Bias is a trading tool that helps forecast market direction by analyzing the previous day's high and low price levels to predict potential market movements.
A pattern detection indicator designed to identify consecutive bullish or bearish candlestick formations across different timeframes, revealing potential market maker movements and trend signals.
A Pinescript tool for visualizing Risk Reward Ratio boxes with custom time markers, helping traders track trade duration and potential trade effectiveness.
Likes, views, and comments are historical TradingView snapshots. They describe attention, not trading performance.