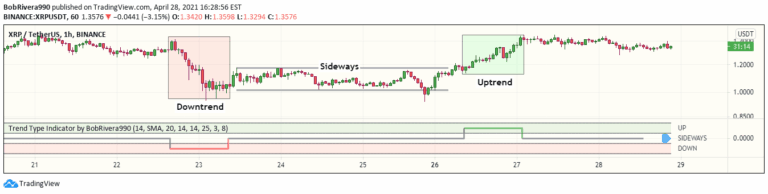
Trend Type Indicator by BobRivera990
A technical analysis signal that uses ATR and ADX to detect market trends, distinguishing between uptrend, downtrend, and sideways movements by analyzing price volatility and directional momentum.
Explore 11,183 indicators. Filter beyond the obvious.
Discover the tools that fit the way you trade.
11,183 tools to explore
A technical analysis signal that uses ATR and ADX to detect market trends, distinguishing between uptrend, downtrend, and sideways movements by analyzing price volatility and directional momentum.
Global Liquidity Index tracks worldwide central bank balance sheets, providing a comprehensive view of global monetary conditions and potential market trends through consolidated financial data.
A range-based indicator that highlights price ranges to help identify potential breakouts and trading opportunities by visually marking key price levels and market movements.
A trading indicator that identifies potential liquidity zones by analyzing volume or open interest to reveal possible liquidation levels and market activity zones.
The Turtle Trade Channels Indicator (TUTCI) is a trend-following system that identifies market breakouts and captures significant price movements using Donchian Channels.
The Diluted Earnings Per Share Signal (DEPSS) is a fundamental indicator that analyzes earnings surprises by comparing diluted EPS to analyst estimates to generate trading signals.
A spider chart visualization tool that combines multiple oscillators to provide a comprehensive view of market sentiment and trend dynamics using normalized indicators.
Open Interest Delta indicator tracks changes in open/unsettled positions, visualizing net increases or decreases through a heatmap and colored candles to help traders analyze market positioning.
Advanced machine learning trading strategy utilizing signal processing techniques and custom moving averages to generate precise housing market trading signals and performance metrics.
Global Net Liquidity tracks total central bank assets across major economies, providing a comprehensive view of monetary conditions and potential market impacts.
A trading indicator designed to identify sideways or ranging markets by tracking significant price candles and establishing dynamic range boundaries based on price movement.
A powerful seasonal trading indicator that reveals market patterns by analyzing historical price movements across different market cycles, including presidential election impacts.
Likes, views, and comments are historical TradingView snapshots. They describe attention, not trading performance.