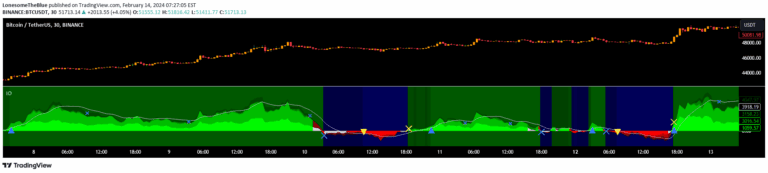
Ichimoku
Ichimoku Kinko Hyo is a comprehensive technical indicator that provides insights into trend direction, momentum, and potential support and resistance levels using multiple components.
Explore 11,183 indicators. Filter beyond the obvious.
Discover the tools that fit the way you trade.
11,183 tools to explore
Ichimoku Kinko Hyo is a comprehensive technical indicator that provides insights into trend direction, momentum, and potential support and resistance levels using multiple components.
An advanced all-in-one trading strategy builder that combines over 30 indicators to generate custom buy and sell signals across multiple timeframes and trading styles.
An advanced Ichimoku Kinko Hyo indicator with extensive customization options for analyzing market trends, momentum, and potential trading signals across different timeframes.
Ichimoku Oscillator is a multi-layered technical analysis tool that evaluates market trends using Ichimoku Cloud features, providing insights into potential entry and exit points.
A comprehensive Ichimoku trading tool that combines multiple theories to analyze market trends, cycles, waves, and potential price targets using advanced Japanese technical analysis techniques.
An advanced Ichimoku-based oscillator that provides comprehensive market trend analysis by converting complex cloud components into a streamlined, color-coded momentum indicator.
A dynamic support and resistance dashboard that visualizes market cycle shifts through dot indicators tracking key technical levels like Ichimoku Cloud and ZLEMA across different price zones.
A multi-indicator trading tool combining Supertrend, HalfTrend, Ichimoku Cloud, and Parabolic SAR to provide comprehensive trend and reversal analysis with a unique Master Candle feature.
A comprehensive trading indicator combining Ichimoku, volume-weighted channels, color-coded candles, and extreme reversal zone detection to provide advanced market analysis.
Kijun Sen is a mid-point indicator from the Ichimoku Cloud that helps traders identify trend direction by measuring the 26-period high and low price midpoint.
An Ichimoku cloud-based indicator that visualizes trend changes and momentum strength through color-coded columns and a trend change diamond line.
A comprehensive trading chart package featuring multiple integrated indicators designed to provide traders with a multi-dimensional view of market dynamics and potential trend signals.
Likes, views, and comments are historical TradingView snapshots. They describe attention, not trading performance.