FluidTrades - SMC Lite
A trading indicator that uses pivot points to identify supply and demand zones, market structure, and potential trading opportunities through visual analysis of price action.
Explore 11,183 indicators. Filter beyond the obvious.
Discover the tools that fit the way you trade.
11,183 tools to explore
A trading indicator that uses pivot points to identify supply and demand zones, market structure, and potential trading opportunities through visual analysis of price action.
A comprehensive price action toolkit that analyzes market structure, liquidity, order blocks, and trend lines to help traders identify potential entry and exit points.
Advanced trading system integrating baseline detection, squeeze momentum, and vortex filtering to generate high-probability trade setups across multiple market conditions.
MACD is a trend-following momentum indicator that uses moving averages to identify changes in market momentum, trend reversals, and potential trading signals.
Footprint Lite tracks volume distribution across price levels, enabling traders to analyze market dynamics through customizable visual representations of trading activity.
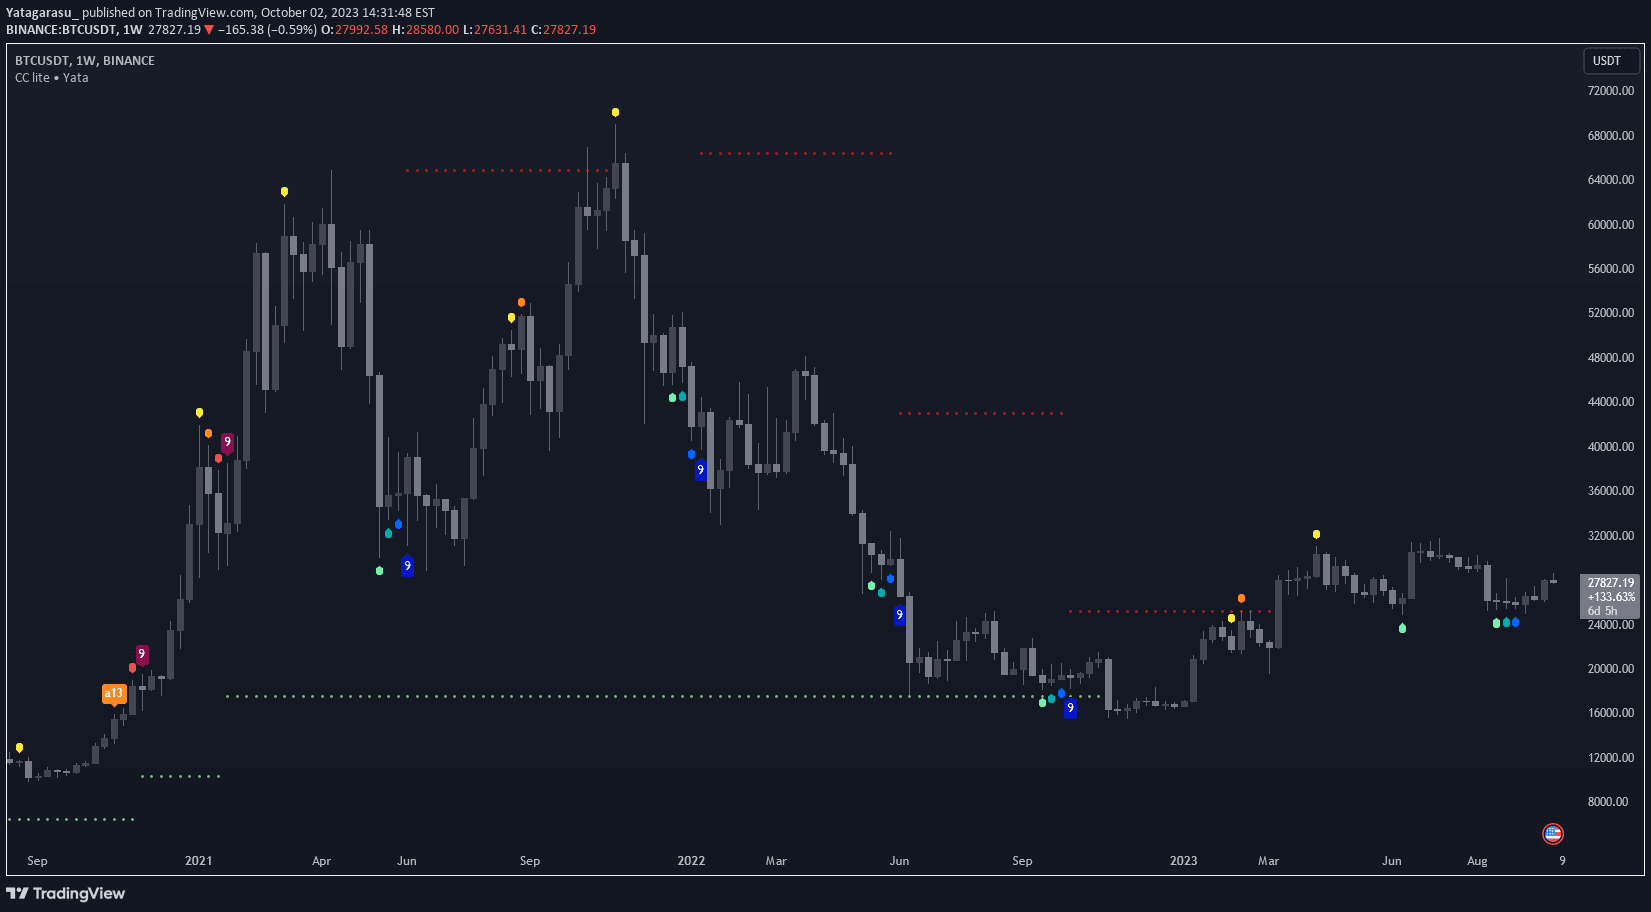
A trading signal that identifies potential turning points in asset prices by displaying configurable numbers and tracking support and resistance levels for trend analysis.
A trading session indicator that displays and analyzes specific trading periods, helping traders understand market dynamics and potential trading opportunities across different global market sessions.
Previous OHLC tracks the opening, high, low, and closing prices from the last trading period, providing key insights into market sentiment and potential price action.
A multi-pivot trading indicator combining RSI, MACD, and pivot points to identify potential market reversals and trend changes with high-probability signals.
A powerful trading tool designed to help traders identify profitable market opportunities by spotting breakouts, pullbacks, and critical support and resistance levels with precision.
A multi-timeframe chart indicator that overlays price movement boxes across different time periods, providing traders with a comprehensive visual analysis of market dynamics.
A multi-timeframe indicator that visualizes price movements across different timeframes using colored boxes, helping traders identify trends, support/resistance levels, and potential market changes.
Likes, views, and comments are historical TradingView snapshots. They describe attention, not trading performance.