ICT Killzones Toolkit [LuxAlgo]
ICT Killzones Toolkit is a comprehensive trading analysis system that identifies key market zones, patterns, and institutional trading levels using multiple price action components.
Explore 11,183 indicators. Filter beyond the obvious.
Discover the tools that fit the way you trade.
11,183 tools to explore
ICT Killzones Toolkit is a comprehensive trading analysis system that identifies key market zones, patterns, and institutional trading levels using multiple price action components.
A footprint bar indicator that visualizes volume or open interest data within the chart's visible range, offering three different heatmap styles to analyze trading activity.
A trading indicator that calculates volume delta and open interest delta, providing insights into market sentiment and trading activity across different price levels and asset types.
An advanced Open Interest indicator that provides comprehensive market insights through multiple visualization techniques and real-time statistical analysis of trading positions.
An advanced trading tool that analyzes price ranges by automatically drawing range levels, volume profiles, and various analytical tools to help traders understand market structure and potential price movements.
An advanced liquidity heatmap that accumulates and tracks resting liquidity levels over time, revealing potential high-impact price zones by aggregating volume across multiple price levels.
An advanced Open Interest indicator that visualizes market positioning by tracking contract changes and aggregating trading activity across different price levels.
A multi-asset performance indicator that tracks percentage changes across 30 symbols, offering comprehensive insights into asset performance, correlation, and market dynamics.
An advanced trading indicator that analyzes open interest and price action to visualize market positioning, tracking net long and short positions with multiple analytical tools.
A trading indicator that identifies potential liquidity zones by analyzing volume or open interest to reveal possible liquidation levels and market activity zones.
A multi-faceted crypto trading indicator that tracks liquidation ranges, volume/OI dots, and identifies high-volume price areas using advanced volume and open interest analysis.
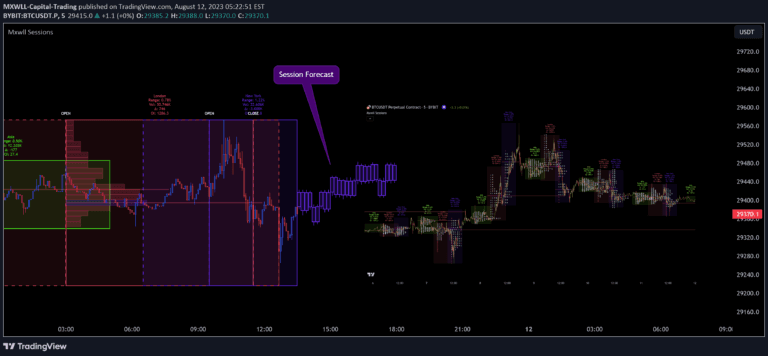
A comprehensive market session indicator that displays TPO profiles, market session times, volume delta, and price forecasts across different trading periods with advanced statistical analysis.
Likes, views, and comments are historical TradingView snapshots. They describe attention, not trading performance.