
YOUR INDICATOR RESEARCH STARTS HERE

Find the right indicator.
Understand what it does.

Explore 11,183 indicators. Filter beyond the obvious.
Discover the tools that fit the way you trade.

THE INDICATOR LIBRARY

Results for “RIP”

11,183 tools to explore

163 indicators matching your filters
Save search
TrendVolatilityEditor’s pick

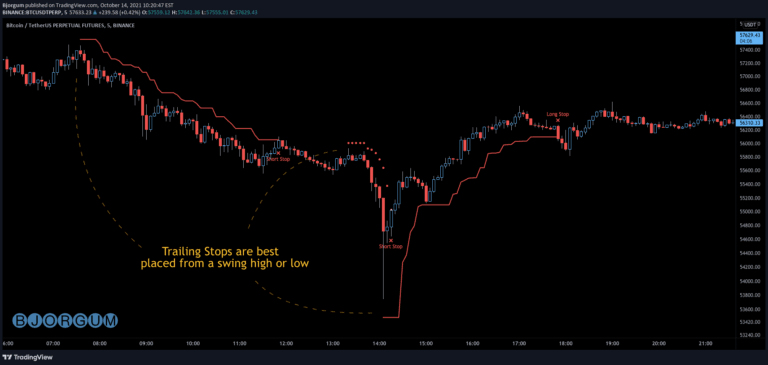
Bjorgum AutoTrail

by Bjorgum

A versatile trailing stop management script for crypto and forex traders, offering multiple trail types to protect profits and manage risk dynamically during ongoing trades.

Main price chart · unverifiedDay Trading · Swing Trading
Explore
4.9Klikes105.7Kviews77comments

Save
TrendMomentumEditor’s pick

Indicator Panel

by LonesomeTheBlue

A dynamic trading panel displaying multiple technical indicators in a color-coded table format, allowing traders to quickly assess market conditions across multiple symbols simultaneously.

Separate pane · unverifiedDay Trading · Swing Trading
Explore
4.6Klikes76.9Kviews80comments
Save
VolumeEditor’s pick

Tick Data Detailed

by LonesomeTheBlue

A tick data analysis tool that breaks down trading volume into different levels, revealing trading activity from different market participant types and detecting potential volume anomalies.

Separate pane · unverifiedScalping · Day Trading
Explore
4.3Klikes79.3Kviews93comments
Save
TrendMomentumEditor’s pick

Flag Finder

by Amphibiantrading

Flag Finder is a technical analysis tool that identifies bullish and bearish flag patterns, helping traders detect potential price continuation signals during market trends.

Main price chart · unverifiedDay Trading · Swing Trading
Explore
3.3Klikes100.4Kviews71comments
Save
TrendEditor’s pick

Monthly Returns in PineScript Strategies

by QuantNomad

A custom trading tool that generates monthly and yearly performance tables for trading strategies, helping traders analyze historical strategy performance and identify key periods of success or weakness.

Separate pane · unverifiedSwing Trading
Explore
3.2Klikes67.8Kviews78comments
Save
VolumeSignalLevels

Liquidity Heatmap [BigBeluga]

by BigBeluga

A trading indicator that identifies potential liquidity zones by analyzing volume or open interest to reveal possible liquidation levels and market activity zones.

Main price chart · unverifiedScalping · Day Trading
Explore
2.8Klikes97.4Kviews34comments
Save
SignalTrend

Triple Smoothed Signals [AlgoAlpha]

by AlgoAlpha

A sophisticated trend indicator that uses triple smoothing to filter market noise and identify potential trend directions through moving average crossovers and dynamic color visualization.

Main price chart · unverifiedScalping · Day Trading
Explore
2.7Klikes40.3Kviews12comments
Save
ChannelsLevelsTrend

Triple Trend Indicator [BigBeluga]

by BigBeluga

A dynamic trend-following indicator using three adaptive bands to visualize market trends, price deviations, and potential pullback levels with color-coded signals.

Main price chart · unverifiedScalping · Day Trading
Explore
1.7Klikes28.1Kviews27comments
Save

Likes, views, and comments are historical TradingView snapshots. They describe attention, not trading performance.

START WITH A QUESTION

A little less searching.
A lot more understanding.

Tell DeepAlpha what you need. Get an explanation, a shortlist,
and a direct path to the indicators behind it.

Ask DeepAlpha
