Fibonacci Time-Price Zones
Fibonacci Time-Price Zones is an advanced indicator that combines Fibonacci ratios with time and price analysis, offering multiple geometric visualization methods to identify market turning points.
Explore 11,183 indicators. Filter beyond the obvious.
Discover the tools that fit the way you trade.
11,183 tools to explore
Fibonacci Time-Price Zones is an advanced indicator that combines Fibonacci ratios with time and price analysis, offering multiple geometric visualization methods to identify market turning points.
Volume Profile is a trading indicator that maps trading volume across different price levels, revealing key market insights like Value Area, Point of Control, and session price ranges.
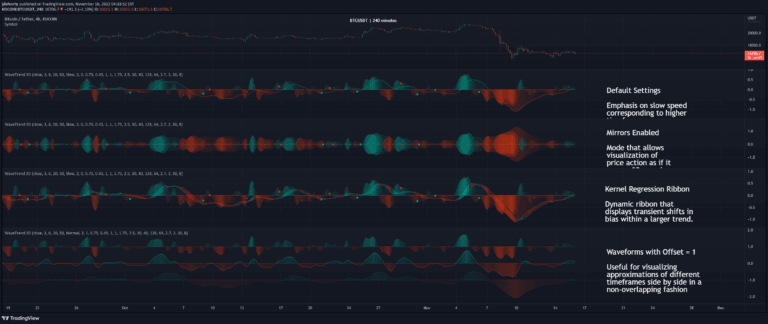
WaveTrend 3D is an advanced oscillator that uses digital signal processing and machine learning techniques to analyze price trends with enhanced precision and multi-timeframe support.
A flexible price filtering tool that resamples and analyzes market data using multiple methods and advanced moving average techniques to reduce noise and identify underlying price trends.
Advanced script identifying potential trend reversals using Three White Soldiers and Three Black Crows candlestick patterns with moving average filtering and cooldown mechanism.
A trading indicator that plots high/low levels for key trading sessions and identifies RTH opening gaps, providing potential entry and exit areas for traders.
Camarilla Pivot Points indicator that automatically calculates and suggests trading plays using daily pivot levels, providing entry, stop-loss, and target points for traders.
A trading indicator that captures 30-second opening ranges from different market sessions and generates dynamic price targets based on these initial market movements.
A dynamic trading indicator using a Two Pole Butterworth filter to smooth price data and a for-loop scoring mechanism to generate trading signals based on price momentum.
An advanced trading concept that identifies overnight price gaps in futures markets, using specific time frames and standard deviation projections to analyze potential market movements and liquidity zones.
A visual indicator that highlights the trading gap between previous day's closing price and current day's opening price, showing potential price filling opportunities.
A custom oscillator combining Hull Moving Average and Z-Score to detect momentum shifts and potential trend reversals by measuring price deviation from historical mean.
Likes, views, and comments are historical TradingView snapshots. They describe attention, not trading performance.