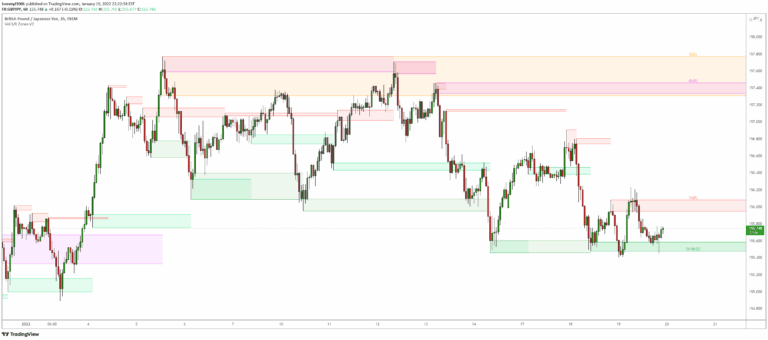
Volume-based Support & Resistance Zones
An advanced Support & Resistance indicator that identifies significant price zones using volume and fractal highs/lows, helping traders visualize potential trend reversals and continuations.
Explore 11,183 indicators. Filter beyond the obvious.
Discover the tools that fit the way you trade.
11,183 tools to explore
An advanced Support & Resistance indicator that identifies significant price zones using volume and fractal highs/lows, helping traders visualize potential trend reversals and continuations.
CM MACD Ultimate Multi-Timeframe V2 is an advanced MACD indicator with enhanced customization options, multi-timeframe analysis, and comprehensive trend visualization features.
An advanced all-in-one trading strategy builder that combines over 30 indicators to generate custom buy and sell signals across multiple timeframes and trading styles.
FATS is an advanced trading indicator that automatically draws trend lines, Fibonacci levels, and trend sights across multiple timeframes to help traders identify market direction and potential support/resistance zones.
Double Tap is a pattern recognition strategy that identifies double top and double bottom formations, providing entry signals based on price action reversals and breakout patterns.
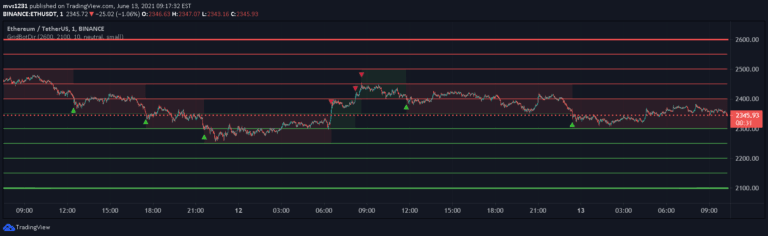
A grid trading bot simulator that divides price ranges into zones, generating trading signals based on price movement in ranging and trending markets with customizable grid settings.
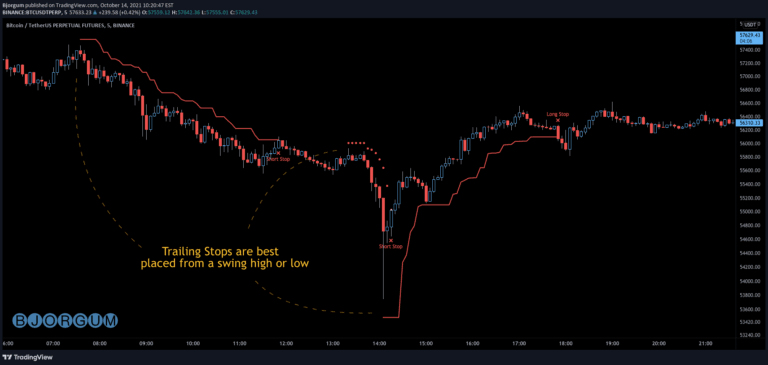
A versatile trailing stop management script for crypto and forex traders, offering multiple trail types to protect profits and manage risk dynamically during ongoing trades.
A range-based indicator that highlights price ranges to help identify potential breakouts and trading opportunities by visually marking key price levels and market movements.
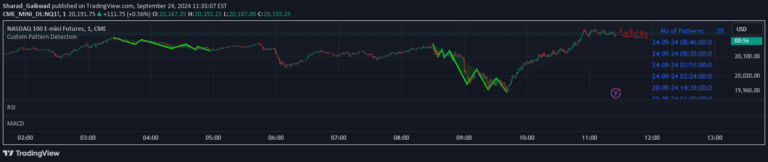
A customizable chart pattern detection tool that allows traders to define and identify specific pattern formations across multiple market scenarios using flexible input parameters.
A trend line indicator that automatically detects and plots resistance and support trend lines by connecting swing highs and lows on a price chart using dynamic pivot point detection.
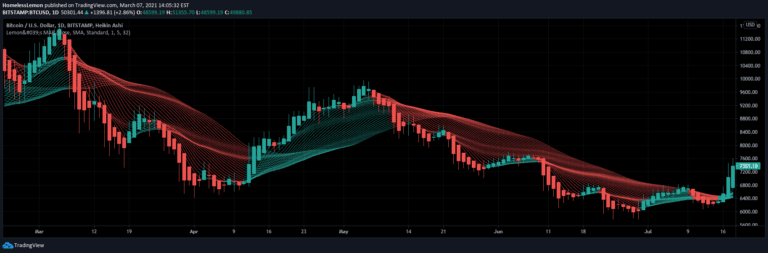
A customizable moving average ribbon indicator that helps traders analyze trend strength and direction by plotting multiple moving averages with adjustable parameters and visual themes.
A specialized trading tool for identifying and executing harmonic patterns using the XABCD methodology, simplifying complex pattern recognition and trade management for both novice and experienced traders.
Likes, views, and comments are historical TradingView snapshots. They describe attention, not trading performance.