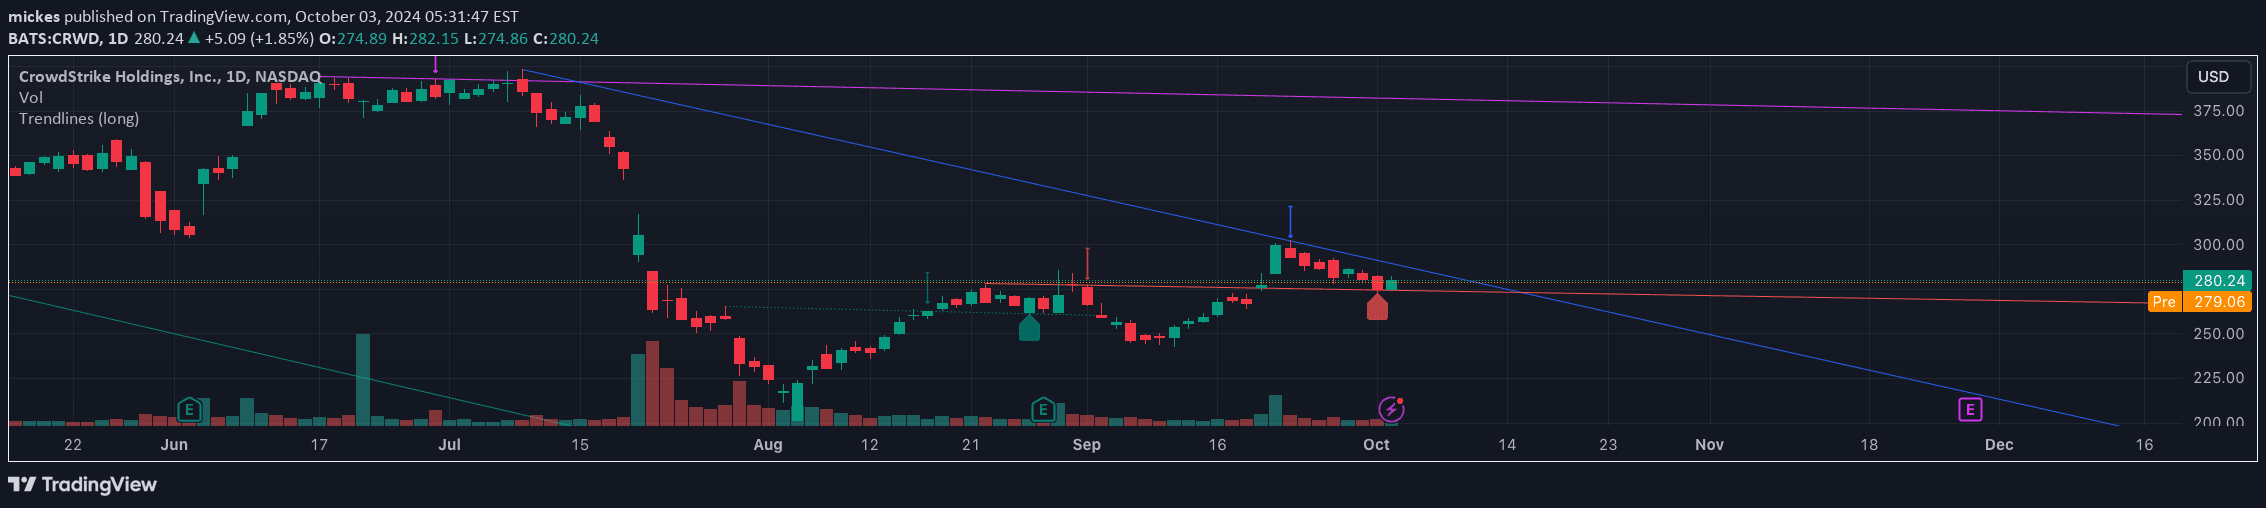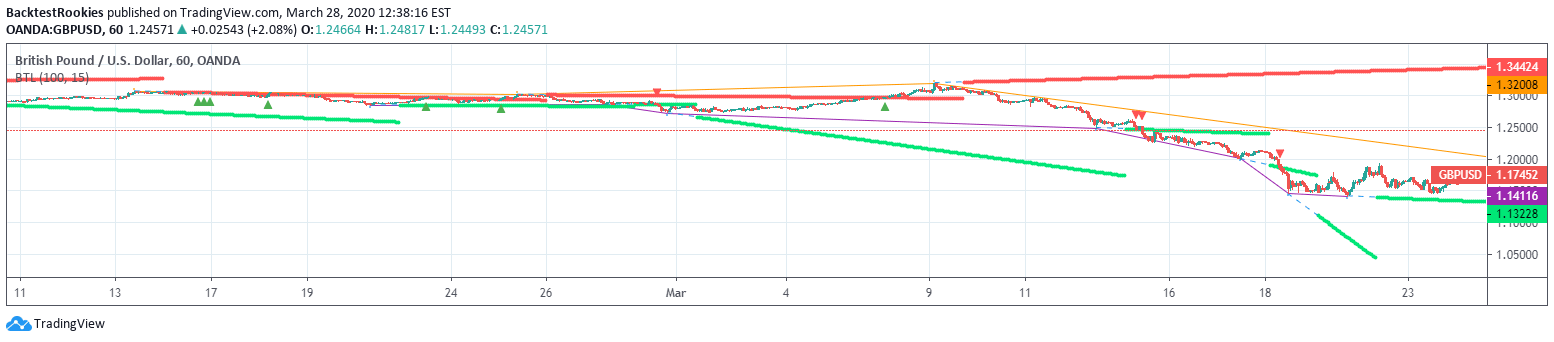
A trend line indicator that automatically detects and plots resistance and support trend lines by connecting swing highs and lows on a price chart using dynamic pivot point detection.
Explore complementary indicator rolesHow it works
The indicator identifies swing highs and lows in price action to create dynamic trend lines. It uses pivot point detection to mark significant price turning points with blue or orange circles. As new pivots are detected, the trend lines adjust, connecting the most recent swing points.
The system generates two primary trend lines: a resistance trend line using swing highs (marked in red) and a support trend line using swing lows. Traders can customize the swing detection sensitivity by adjusting parameters like rightbars to control the trend line creation process
Why it may be useful
Trend line indicators provide crucial visual insights into market direction and potential support/resistance levels. By automatically detecting and plotting these lines, traders can quickly identify key price action patterns without manual drawing.
The dynamic nature of the indicator allows for real-time trend analysis, helping traders recognize potential trend changes and entry/exit points. It reduces subjective interpretation by using mathematical pivot point detection, making trend identification more systematic and objective
When to explore it
This trend line indicator works best in markets with clear directional movements and defined swing highs and lows. It is particularly useful for swing traders and technical analysts who rely on trend identification.
The indicator is most effective in trending markets like stocks, forex, and cryptocurrencies. Traders should use it in conjunction with other technical analysis tools to confirm signals. The customizable pivot detection allows adaptation to different market conditions and trading styles
Keep exploring
What we’ve verified
Access, alerts and repainting behaviour have not been independently verified for this indicator. Check the creator’s current publication and settings.
General descriptions and classifications are recovered research. Verified details above identify the specific checks we have completed. Check the creator’s current publication for later changes.