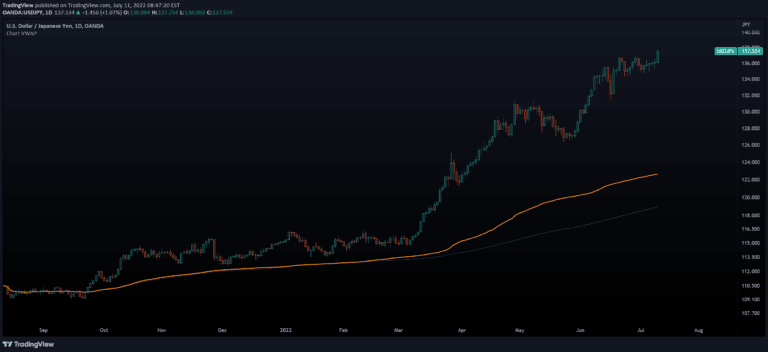
Chart VWAP
A dynamic Volume-Weighted Average Price (VWAP) indicator that calculates on visible chart bars, offering traders a flexible way to analyze price movement and volume across different chart views.
Explore 11,183 indicators. Filter beyond the obvious.
Discover the tools that fit the way you trade.
11,183 tools to explore
A dynamic Volume-Weighted Average Price (VWAP) indicator that calculates on visible chart bars, offering traders a flexible way to analyze price movement and volume across different chart views.
A customizable moving average ribbon indicator that helps traders analyze trend strength and direction by plotting multiple moving averages with adjustable parameters and visual themes.
A multi-timeframe trend channel indicator that generates buy and sell signals by analyzing trend directions across different timeframes with intelligent filtering and dynamic visualization.
A machine learning-based standard deviation oscillator that helps traders identify market momentum, support and resistance levels, and potential overbought or oversold conditions.
Dynamic Point of Control (POC) indicator analyzes price levels, volume distribution, and market sentiment within a specified historical range. It provides real-time insights for technical analysis.
A volume-weighted moving average crossover strategy that combines price and volume data to identify trend reversals and confirm market sentiment using VWMA and SMA indicators.
A customizable Ichimoku variant that allows users to modify indicator lines using volume-weighted calculations and additional trend analysis features.
A comprehensive moving averages indicator allowing configuration of up to 5 different moving average types, with customizable parameters and a unique Smart Opacity feature for trend visualization.
The Volume-Adjusted Bollinger Bands (VABB) is an advanced technical analysis tool that combines price bands with volume data to provide dynamic insights into market movements and volatility.
An intraday trading indicator using EMA9 and VWMA crossovers to generate precise buy and sell signals by combining price action with volume confirmation.
A trading signal that identifies potential buy and sell opportunities by analyzing sudden volume surges combined with RSI overbought and oversold conditions.
A volatility indicator that detects market anomalies by calculating the delta between volume-weighted and simple moving averages and applying statistical analysis to identify extreme price movements.
Likes, views, and comments are historical TradingView snapshots. They describe attention, not trading performance.