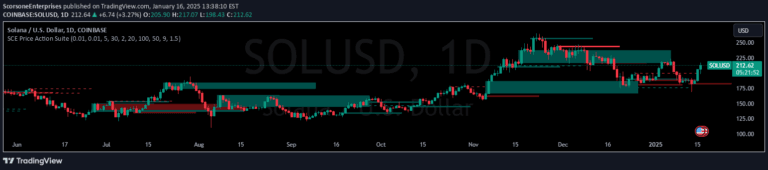
Fair Value Gap Absorption Indicator [LuxAlgo]
A trading indicator that identifies market inefficiencies or price imbalances called fair value gaps, helping traders detect potential price reversal or continuation zones.
Explore 11,183 indicators. Filter beyond the obvious.
Discover the tools that fit the way you trade.
11,183 tools to explore
A trading indicator that identifies market inefficiencies or price imbalances called fair value gaps, helping traders detect potential price reversal or continuation zones.
A trading indicator designed to identify market liquidity zones and potential reversal areas by analyzing candle structures, wick-to-body ratios, and market sentiment shifts.
A trading strategy focused on identifying market liquidity zones and capturing trend reversals through precise entry points using PM Session range and liquidity hunt techniques.
An indicator that identifies price absorption points by tracking volume accumulation at specific levels, revealing potential market sentiment shifts and liquidity zones.
A trading indicator that identifies price imbalances like fair value gaps and large candle wicks across different timeframes, helping traders spot potential liquidity and rebalancing opportunities.
A real-time indicator that tracks tick volume and direction to provide insights into buying and selling pressure in the market, helping traders understand current market dynamics.
A unique 3-fractal swing indicator that adjusts market structure points by absorbing three candles, providing enhanced trading insights through strategic swing identification.
A multi-layered trend detection tool for intraday traders that combines TEMA cloud, session sweeps, and volume analysis to identify high-probability market reversals and continuations.
A multi-feature trading indicator that analyzes market data using eight different techniques to identify potential price action levels and trading opportunities across various market conditions.
A specialized trading indicator that analyzes high-volume market events by examining volume absorption and its relationship to price movements, providing insights into potential market trends.
A trading indicator that combines volume dynamics, price action patterns, and Point of Control to highlight potential high-probability trade zones with customizable sensitivity settings.
A trading strategy simulating order flow dynamics by analyzing candle characteristics, volume, and price movement to detect absorption, impulse, and re-entry trading opportunities.
Likes, views, and comments are historical TradingView snapshots. They describe attention, not trading performance.